
Figures & data
Figure 1. Representative images of YTHDF1, YTHDF2, and TIL expression in immunohistochemistry
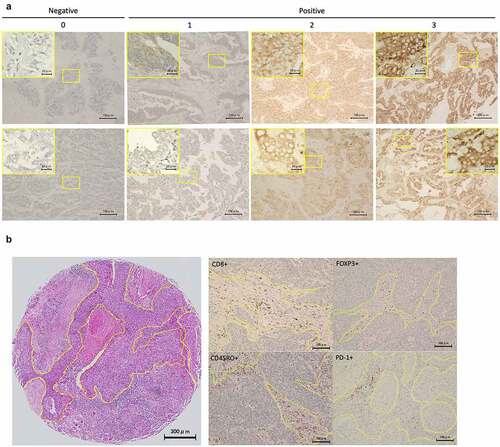
Figure 2. Level of YTHDF1 and YTHDF2 expression is elevated in NSCLC
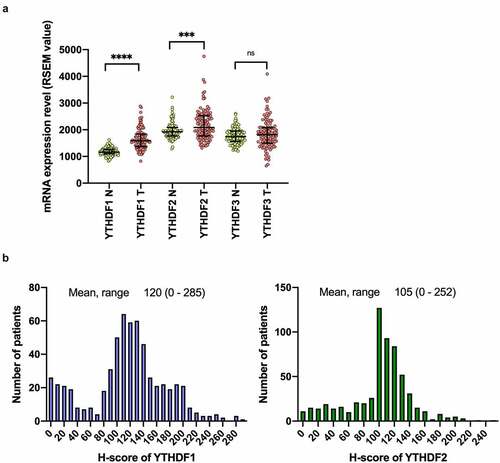
Table 1. Comparison of clinical characteristics based on YTHDF1 and YTHDF2 expression in the tumor
Table 2. Univariate and multivariate Cox hazards model analyses for overall survival of patients with non–small-cell lung cancer
Table 3. Univariate and multivariate Cox hazards model analyses for recurrence-free survival of patients with non–small-cell lung cancer
Figure 3. Survival curves according to YTHDF1 and YTHDF2 expression in patients with non–small-cell lung cancer (NSCLC)
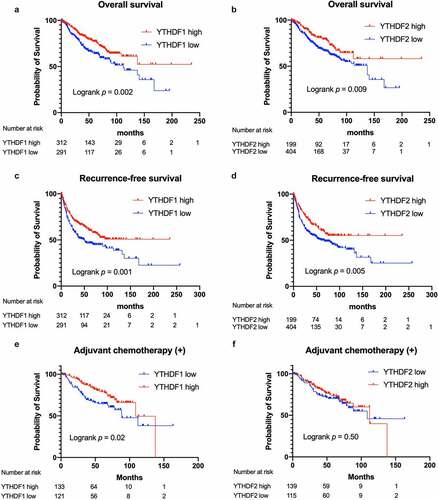
Figure 4. Expression of YTHDF1 and YTHDF2 is associated with tumor-infiltrating lymphocytes (TILs) in the stroma in patients with non–small-cell lung cancer
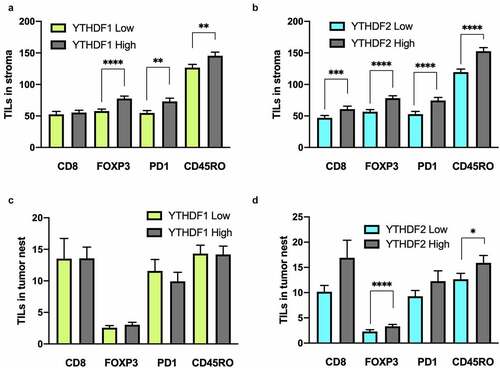
Figure 5. YTHDF1 and YTHDF2 knockdown suppresses cell proliferation and partially induces apoptosis in lung cancer cells
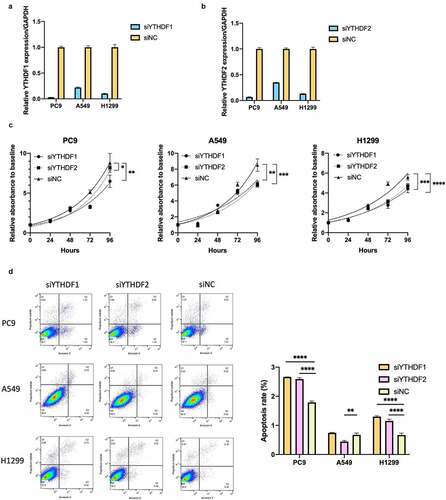
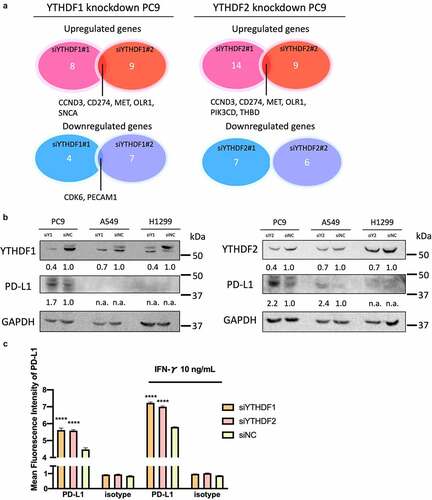
Figure 6. YTHDF1 and YTHDF2 knockdown increased tumoral PD-L1 expression in lung cancer cells
Supplemental Material
Download ()Data availability:
All data and supplemental information within the article are available from the corresponding author upon reasonable request.