Figures & data
Figure 1. A set of 307 PTC-specific IRGs were identified. Cumulative proportion curves showed that the immune scores were continuously distributed at the significantly higher side compared with stromal scores in both (a) xCell and (b) ESTIMATE outputs, indicating the predominant role of immune infiltration in PTC tumor microenvironment (TME). (c) A correlation network reflects the comprehensive relationships among different immune cell types involved in PTC TME. (d) The weighted gene co-expression network analysis (WGCNA) was performed with the IRGs expression matrix of 94 samples and their sample category (tumor or normal thyroid) to construct a scale-free co-expression network. (e) Three gene modules were generated, and a blue module exhibited the highest correlation with sample category (|r| = 0.9, P = 4e-35) and was considered as “PTC-specific module”. (f) Limma algorithm was used to identify a total of 492 DE-IRGs between PTC and normal thyroid samples with a filtering threshold of FDR Q value less than 0.01. (g) 307 overlapping genes in the intersection of “PTC-specific module” and “DE-IRGs” were considered as “PTC-specific IRGs”. DE-IRGs: differentially expressed immune-related genes. (h) PCA analysis demonstrated that PTC and normal thyroid samples were clearly separated as two distinct groups in the discovery cohort with the 307 PTC-specific IRGs expression matrix. (i-k) Three datasets (GSE60542, GSE3467, GSE3678) were used to validate the discriminative capacity of the 307 PTC-specific IRGs, and the dissimilarity between different sample categories was visualized in PCA analysis.
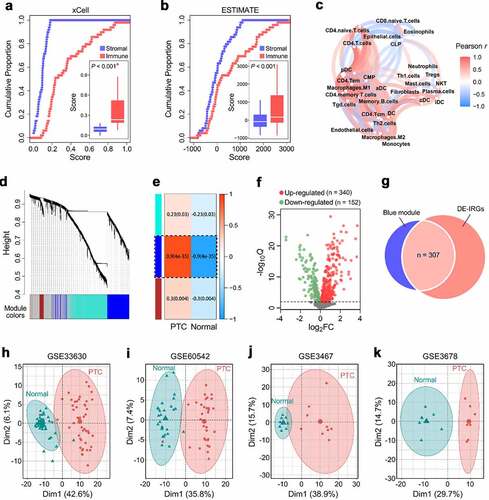
Figure 2. Two distinct immune clusters were identified with PTC-specific IRGs. (a) Based on the expression matrix of 307 PTC-specific IRGs, the TCGA PTC cohort (n = 496) were divided into two distinct immune clusters (C1 and C2) with the optimal NMF k value of 2. (b) GSEA analysis demonstrated that C2 exhibited significantly higher activity of various immune processes compared with C1. GO: gene ontology; NES: normalized enrichment score; padj: adjusted P value. (c) A comprehensive heatmap illustrates the differences of clinicopathological features, immune checkpoints, cytolytic activity signature and IFN-γ response signature between the two clusters. (d) A Sankey diagram depicts the flow from the two immune clusters to different variants and pathological stages, in which the width of the flow rate is proportional to the patient number. (e) TIDE algorithm was applied to evaluate the potential ICB response of each PTC sample, and the proportion of responders is significantly elevated in C2 (P = .004). ICB: immune checkpoint blockade; NR: non-responder; R: responder. (f) A stacked barplot illustrated the distinct patterns of the relative proportion of 22 immune cell types in the two immune clusters, and macrophage M2 accounts for the highest proportion among all the immune cells. (g) Most of the 22 immune cell types were differentially distributed between the two immune clusters. NS: no significance. (h) T cell infiltration score (TIS) was significantly elevated in C2 compared with C1 (P < .001).
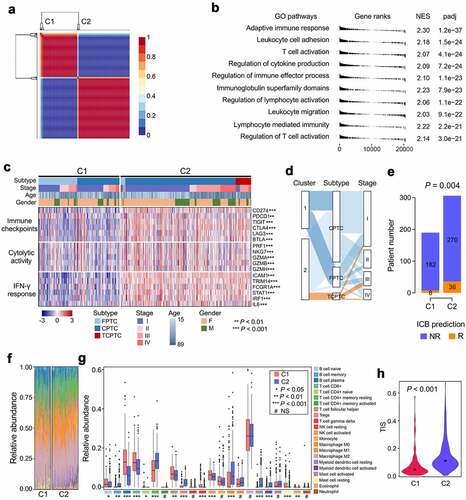
Figure 3. Characterizations of immune and mutational landscape were analyzed in different PTC variants. (a-c) Oncoplots were generated for the three histological variants including FPTC, CPTC and TCPTC respectively, and top 10 frequently mutated genes in each variant were ranked. FPTC: follicular variant PTC; CPTC: classical PTC; TCPTC: tall-cell variant PTC. (d) A community structure plot depicts the common frequent mutations shared by the three variants, and BRAF mutation is the only overlapping mutation. (e) BRAF mutation frequency was stepwisely increased along with the malignant level of variants. (F & G) The immune infiltration score was stepwisely elevated along with the malignant level in both CIBERSORT and ESTIMATE algorithms (both P < .001). (h) Random forest algorithm was applied to screen for the most important IRGs correlated with variant classification. OOB: out-of-bag; ntree: number of decision trees. (i) Nine genes were overlapped in two ranking methods (highlighted in red). (j) GSE27155 including 15 FPTC, 26 CPTC and 10 TCPTC samples was used to validate the discriminative capacity of the nine representative IRGs, and PCA analysis demonstrated the dissimilarity among the three variants based on the nine IRGs expression matrix.
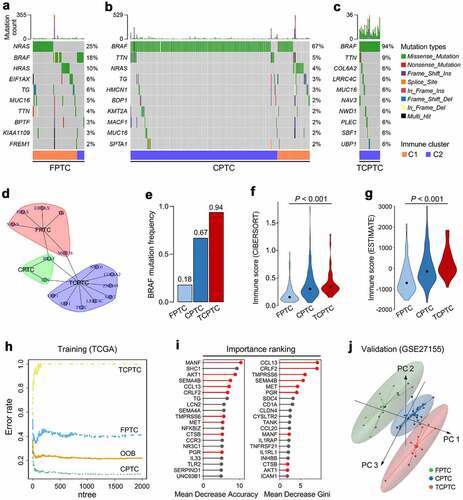
Figure 4. Establishment and validation of the immune-related risk score (IRS) in PTC patients. (a) WGCNA was performed with transcriptome data of the TCGA PTC cohort, and a green module which is mostly correlated with both innate and adaptive immunity was identified as the “immune-related module in PTC”. (b) Univariate Cox regression analysis was performed to calculate the HR and P values for the 1,562 genes involved in the “immune-related module in PTC”. (c) With a filtering threshold of P value less than 0.05, 81 candidates remained and entered into LASSO Cox regression model, and (d) 15 genes were finally filtered with their individual coefficients to construct a prognostic immune-related signature. coef: Cox coefficient. (e) Kaplan-Meier analysis demonstrated that patients with higher IRS exhibited worse prognosis in the training set (HR = 15.90, 95% CI = 7.991–31.63, P < .001). PFS: progression-free survival. (f) In the multivariate Cox regression, IRS was the only independent risk factor among all the variables (P < .001). M: male; F: female; Mut: mutation; WT: wild type; C: CPTC; F: FPTC; TC: TCPTC. (g) IRS’s C-index ranked first among all the variables. C-index: concordance index. (h) In the testing cohort, Kaplan-Meier analysis showed that patients with higher IRS exhibited worse prognosis (HR = 4.707, 95% CI = 1.819–12.18, P = .0071), and (i) multivariate Cox regression analysis demonstrated that IRS was the only independent risk factor (P = .019), and (j) IRS’s C-index ranked first among all the variables.
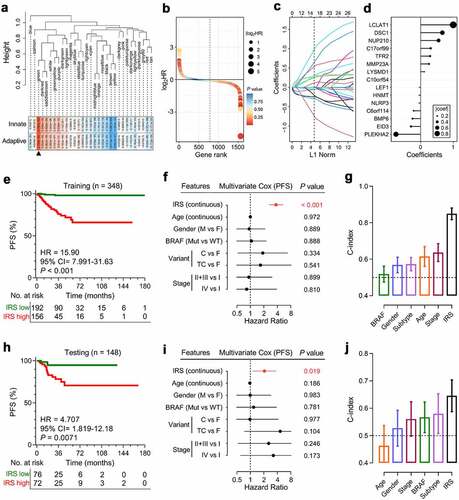
Figure 5. Construction of integrated prognostic models for individual PTC patients. (a) A survival decision tree was built to optimize the prognostic stratification. (b) Significant differences of PFS were observed among the three risk subgroups (P < .001). (c) A personalized scoring nomogram was generated to predict 3- and 5-year PFS probability with the seven parameters, and the arrow shows an example. (d) Calibration curves of 3-year (blue dotted line) and 5-year (red dotted line) PFS prediction were close to the ideal performance (45-degree line). (e) Time-dependent ROC analysis demonstrated that the nomogram exhibited much more powerful capacity of survival prediction compared with conventional clinicopathological characteristics, with an average AUC above 0.8 during a follow-up of 5 years. AUC(t): time-dependent area under the ROC curve.
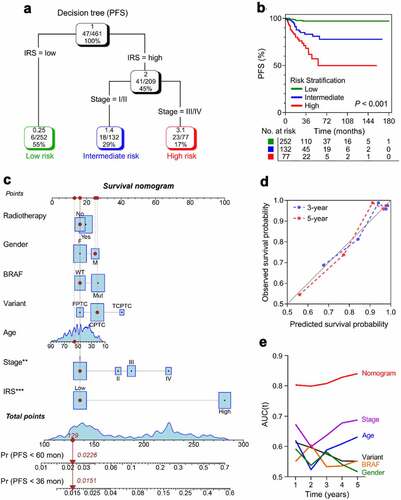
Figure 6. Different immune characteristics and mutational patterns were observed between IRS-high and -low cohorts. (a-d) Compared with IRS-high samples, representative immune checkpoints including LAG3, TIGIT, CTLA4 and PDCD1 were significantly elevated in IRS-low ones, and (e-h) IRS-low cohort was characterized with significantly higher IFNG expression, CYT score and immune score, and lower tumor purity. RSEM: RNA-Seq by Expectation-Maximization. (i) More co-occurrence mutations were observed in IRS-low cohort when compared with IRS-high cohort. (j) With a threshold of P < .05 using Fisher’s exact test, HRAS and NRAS were the only two significant differentially mutated genes detected between IRS-high and -low cohorts. (k) IRS was significantly elevated in HRASMut or NRASMut samples compared with HRAS and NRAS wild type samples. NS: no significance.
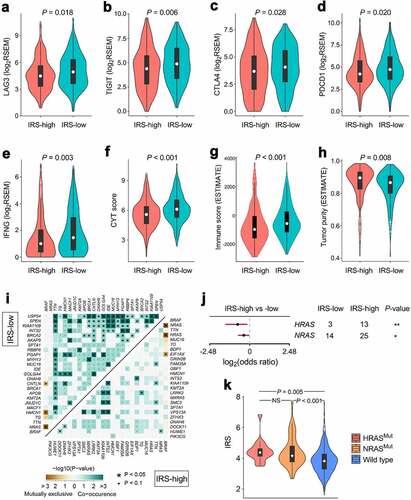
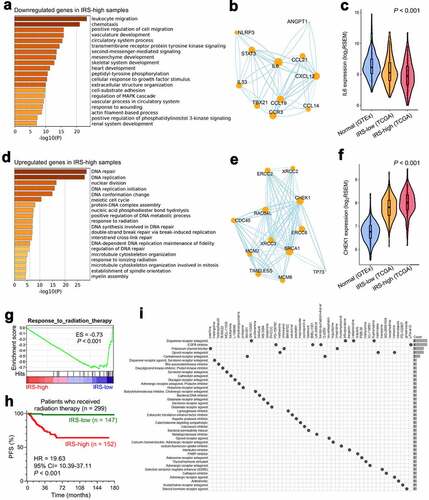
Figure 7. Altered pathways and potential applicable drugs underlying IRS were investigated. (a) Most of the significantly downregulated genes in IRS-high samples were enriched in immune-related biological processes such as “leukocyte migration” as the most important term. (b) A protein-protein interaction network was generated to reveal interactions among representative genes involved in “leukocyte migration”. (c) IL-6 acts as a pivotal regulator in both innate and adaptive immunity, and its expression profile was investigated in normal thyroid and different IRS groups (P < .001). (d) Significantly upregulated genes in IRS-high samples were mainly enriched in cellular responses to external environment such as “DNA repair”. (e) Representative genes involved in “DNA repair” were used to construct a protein-protein interaction network, and (f) the expression profile of a critical checkpoint gene CHEK1 was investigated in normal thyroid and different IRS groups (P < .001). (g) GSEA showed that IRS-high samples exhibited weaker response to radiation therapy compared with IRS-low samples. ES: enrichment score. (h) Among 299 TCGA PTC patients who received radiation therapy, patients with higher IRS exhibited much worse prognosis (HR = 19.63, 95% CI = 10.39–37.11, P < .001). (i) CMap mode-of-action (MoA) analysis revealed 39 mechanisms of action shared by top 50 compounds potentially applicable for IRS-high patients.