Figures & data
Figure 1. Evaluation of TIMs by IHC in patients with HGSOC. a Representative IHC staining images of TIMs in different tumor tissue compartments. Magnification at 200X and 400X. b Numbers of TIMs per HPF were compared between intratumor and stromal tissues (n = 120) and cutoff value of sTIMs and iTIMs were 7.3 cells/HPF and 1.5 cells/HPF respectively. P-value (paired t test). c Relative portion of high and low sTIMs according to FIGO stage. Figures at each box indicated the number of corresponding patients. P-value (pearson’s chi-square test). d Association between sTIMs and FIGO stage. P-value (student’s t test)
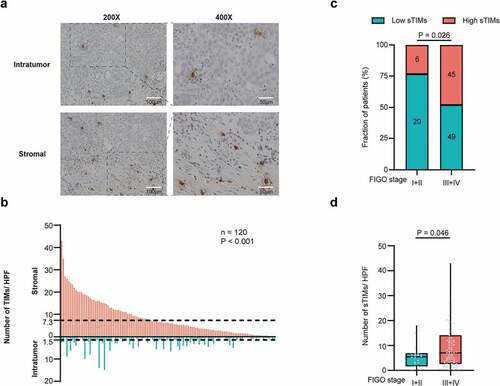
Figure 2. sTIMs predicts poor prognosis in HGSOC. a-b Kaplan-Meier curve was established according to different sTIMs level in Discovery set and Validation set. The overall survival (OS) was compared between patients with high sTIMs and low sTIMs infiltration. Log-rank test was performed for Kaplan-Meier curves. c Kaplan-Meier curve and log-rank test were conducted according to different TIMs level in TCGA set. OS was compared between patients with high TIMs and low TIMs infiltration. Log-rank test was performed for Kaplan-Meier curves. d Univariate and multivariate cox regression for TIMs and clinic-pathological variables in Discovery set (n = 120) and TCGA set (n = 316). HR, hazard ratio; CI, confidence interval; Pos., positive; Neg., negative; LN metastasis, lymph nodes metastasis; SD, stable disease; PD, progressive disease; CR, complete remission; PR, partial remission. Significant P values (P < .05) are bolded
Figure 3. sTIMs link to immunoevasive subtype of HGSOC. a Heat map displayed scaled expression of various immune cells between high (n = 51) and low (n = 69) sTIMs groups and numbers in left boxes indicated the spearman correlation coefficients with corresponding immune cells (**, P < .01; ***, P < .001). b Comparison of the various immune cells between high (n = 51) and low (n = 69) sTIMs groups. P-value (student’s t test). c Heat map displayed scaled expression of various immune molecules between high (n = 51) and low (n = 69) sTIMs groups and numbers in left boxes indicated the spearman correlation coefficients with corresponding molecules (*, P < .05, **, P < .01; ***, P < .001). d Comparison of the various immune molecules between high (n = 51) and low (n = 69) sTIMs groups. P-value (student’s t test). e Proportion of different immune cells of HGSOC specimens with low (n = 18) and high (n = 12) sTIMs level. P-value (student’s t test). f Proportion of immune effector molecules (GZMB, PRF1, and IFN-γ) in CD8+ T cells of HGSOC specimens with low (n = 18) and high (n = 12) sTIMs level. P-value (student’s t test). g Proportion of immune checkpoint molecules (CTLA-4, Tim-3, PD-1, and LAG-3) in CD8+ T cells of HGSOC specimens with low (n = 18) and high (n = 12) sTIMs level. P-value (student’s t test)
Figure 4. Integrated scRNA-seq analysis of patients with HGSOC. a UMAP plot shows the annotation and color codes for cell clusters (n = 18) in HGSOC. b Heatmap of Z-scored expression of the top canonical cell markers of each immune cell populations. The depth of color from red to yellow represents low to high expression. c Inferred interactions of immune cells. The arrow width is the sum of interaction values between two clusters. L-R pairs with a value >10 and P < .05 are shown. d Inferred interactions between mast cells and other immune cells. The arrow width is the sum of interaction values between two clusters. L-R pairs with a value >10 and P < .05 are shown. e Bubble plot shows selected L-R pairs between mast cells and other immune cells. The depth of color from blue to red represents low to high communication probability. The size of the bubble represents corresponding P values. Commun. Prob, communication probability. f Dot plot illustrates the fraction of PD-L1+ Mast cells, in 9 matched tissue and blood samples. Two dimensional FACs plots shows PD-L1+ mast cells from HGSOC tumor tissue (top right panel) and peripheral blood (down right panel). Pb, peripheral blood. g Dot plot illustrates the fraction of TGF-β+ Mast cells, in 9 matched tissue and blood samples. Two dimensional FACs plots shows TGF-β+ mast cells from HGSOC tumor tissue (top right panel) and peripheral blood (down right panel). Pb, peripheral blood
Figure 5. Low sTIMs were associated with better ICB response. a Relative portion of PD-L1 positive rate according to sTIMs level (sTIMs-low group, n = 69; sTIMs-high group, n = 51). PD-L1 positive rate was higher in low sTIMs group. Figures at each box indicated the number of corresponding patients. P-value (pearson’s chi-square test). Pos., positive; Neg., negative. b Comparison of mRNA expression of PD-L1 between HGSOC with high(n = 62) and low(n = 254) TIMs in TCGA set. TPM, transcripts per million. P-value (student’s t test). c Proportion of immune effector molecules (GZMB, and IFN-γ) in CD8+ T cells of 23 HGSOC organoids (low sTIMs, n = 11; high sTIMs, n = 12) in control group and anti-PD-1 group. P-value (paired t test). d Fraction of TIMs between response (n = 20; CR, complete remission; PR, partial remission; SD, stable disease) and nonresponse (n = 5; PD, progressive disease) group in patients with melanoma. P-value (student’s t test). e Nomogram based on FIGO stage, PD-L1, and sTIMs was developed for predicting 3-year survival probability and 5-year survival probability. f Time-dependent ROC curve was established to show the detailed AUC at 3 years (n.s., not significant). g Time-dependent ROC curve was established to show the detailed AUC at 5 years (***, P < .001)