
Figures & data
Table 1. Baseline patient characteristics
Table 2. Treatment-related adverse events
Figure 1. Duration of response and survival
(A) Duration of response. (B) Kaplan–Meier plot of overall survival. (C) Kaplan–Meier plot of progression-free survival. PD-L1 = programmed cell-death protein 1. CR = complete response. PR = partial response. SD = stable disease. Pt = patient.
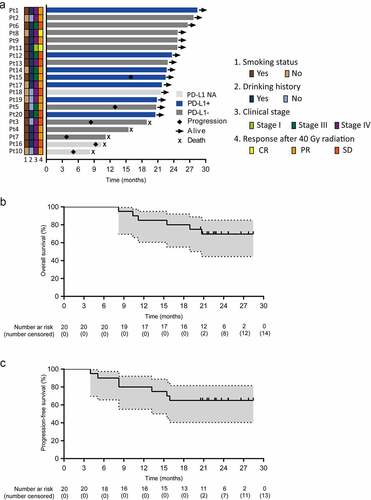
Figure 2. Changes from baseline in EORTC QLQ-C30 and QLQ-OES18
(A) Changes from baseline in QLQ-C30 global health status/quality of life; QLQ-C30 functioning scales (B), QLQ-C30 symptom scales (C), and QLQ-OES18 functioning and symptom scales (D) at weeks 7 and 19. EORTC = European Organization for Research and Treatment of Cancer. Mean change from baseline in Quality of Life Questionnaire-Core 30 (QLQ-C30) global health status (GHS) by visit. Data are shown as mean score changes (95%CIs). A higher score in the functional domains and global health status means better functional status and better QoL. A higher score in the symptom domains indicates more severe symptoms or problems (worse QoL). QLQ-C30 = Quality of Life Questionnaire Core 30. QLQ-OES18 = Quality of Life Questionnaire Module 18 in Esophageal Cancer. GHS = global health status. QoL = quality of life.
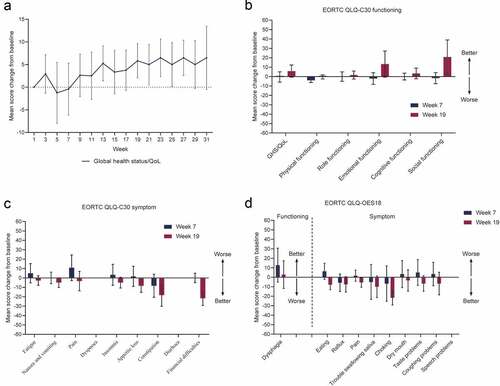
Figure 3. Tumor biomarkers associated with survival
(A) Results of hematoxylin and eosin staining (left), and multi-color immunofluorescence (middle and right) of serial tissue section from patient 19.(B) Changes of tumor immune microenvironment after 40 Gy radiation. Kaplan–Meier plot of overall survival in patients with (C) a baseline PD-L1 ≥ 7.613%; (D) baseline tumor-infiltrated CD11+ dendritic cells ≥2.987%. PD-L1 = programmed cell-death protein 1.
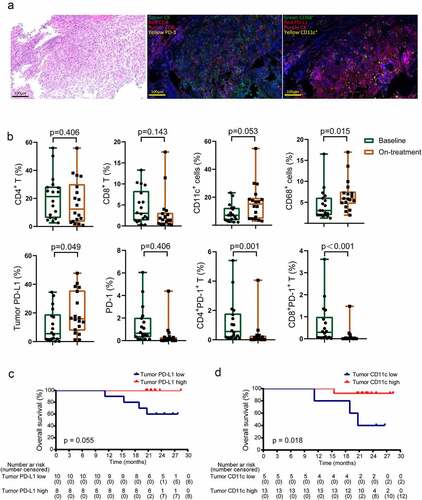
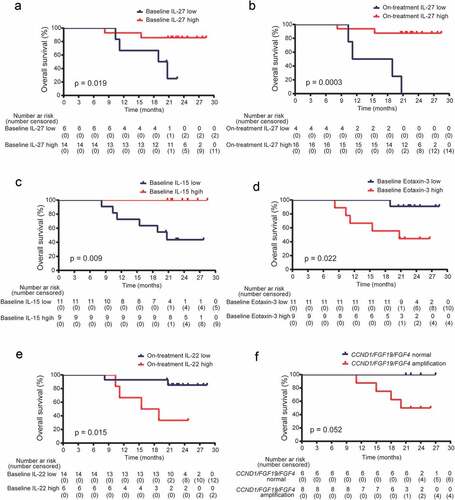
Figure 4. Gene amplification and peripheral cytokines associated with survival
Kaplan-Meier plot of overall survival in patients with a baseline IL-27 ≥ 919.090 pg/mL (A), an on-treatment IL-27 ≥ 1037.75 pg/mL (B), a baseline IL-15 ≥ 2.87 pg/mL (C), a baseline Eotaxin-3 ≥ 22.55 pg/mL (D), an on-treatment IL-22 ≥ 1.015 pg/mL in peripheral blood (E), and CCND1/FGF19/FGF4 gene amplification in tumor tissues (F).
Supplemental material