Figures & data
Figure 1. Expression of B7H6 and HER2 transcripts in different cancer types. (a) Expression data of ERBB2 and NCR3LG1 transcripts from different tumor types from TCGA datasets were analyzed and extracted from the cBioPortal for Cancer Genomics (https://cbioportal.org). (b) Correlation of ERBB2 and NCR3LG1 expression in individual patients with invasive breast carcinoma, colorectal adenocarcinoma and melanoma (spearman and Pearson correlative coefficients are shown). Graphs were generated and correlations were analyzed using the cBioPortal software
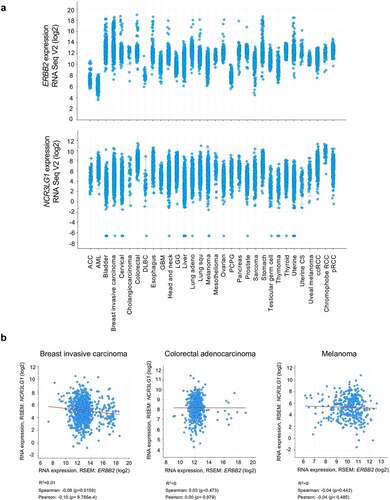
Figure 2. Heterogeneous B7H6 and HER2 protein expression in tumor samples from breast cancer and colon adenocarcinoma patients. (a-b) Immunohistochemistry slides of paired HER2 and B7H6 protein expression for (a) breast cancer and (b) colon cancer tumor samples. Color bars indicate staining intensity. Images were originally obtained from the Human Protein Atlas database (http://www.proteinatlas.org/). Heatmaps showing variability of HER2 and B7H6 expression for each sample. HER2 was stained with a mouse anti-human HER2 antibody (Leica Biosystems, Cat#NCL-CBE-356, RRID:AB_442047) and B7H6 with a polyclonal rabbit anti-human B7H6 antibody (Atlas Antibodies, Cat#HPA024137, RRID:AB_1859534, Sigma-Aldrich)
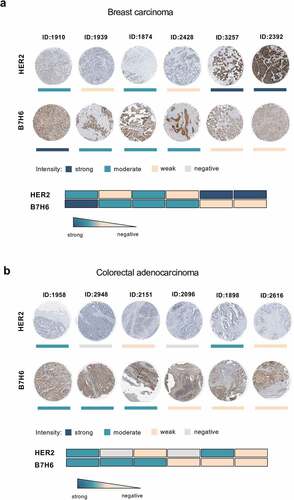
Figure 3. HER2TCR+CD8+ T cells recognize and respond to tumor cells expressing HER2. CD8+ T cells were expanded in the presence of αCD3/CD28 and IL-15 for 3 days, transduced with retroviral particles encoding the HER2TCR and then cultured with IL-15 for 12 more days. (a) Simplified schematic representation of the HER2TCR construct. (b) Cell lines were selected according to HER2 and HLA-A2 expression on the cell surface (isotype control in gray). SKMel37 (melanoma cell line), MCF7 (breast cancer cell line). (c) Dot-plot showing degranulation after co-culture with HER2-expressing target cells. (d) Dot-plot showing gating of the four CD8+ T cell subpopulations according to NKp30 and ectopic HER2TCR expression before FACS-sorting for functional assays. (e) Histogram showing expression of B7H6 on SKMel37.B7H6 tumor cells (isotype control in gray). (f) Graph showing degranulation (CD107a+) on gated HER2TCR+NKp30+, HER2TCR−NKp30+, HER2TCR+NKp30− or HER2TCR−NKp30− T cells after co-culture with SKMel37.B7H6 cells for 4 h in the presence of anti-CD107a antibodies. n ≥ 3 independent experiments, mean±SEM. *P < .05, unpaired students t-test (comparison with the HER2TCR−NKp30− T cell population)
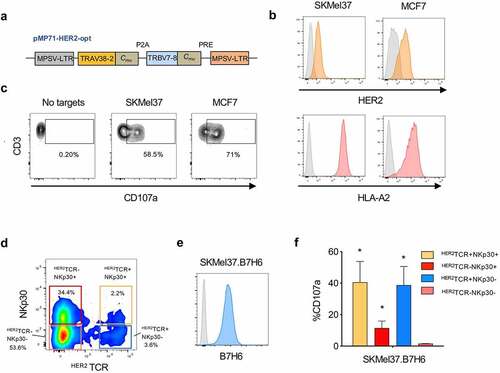
Figure 4. HER2TCR+NKp30+CD8+ T cells can respond to tumor cells both in an MHC-class I-restricted and unrestricted manner. (a) Histogram showing HLA-A2 expression on the surface of parental and B2M KO SKMel37.B7H6 cells (isotype control in gray). (b) Graph showing degranulation (CD107a+) on gated effector populations after co-culture with SKMel37.B7H6 B2M knockout cells, for 4 h in the presence of anti-CD107a antibodies. (c) Percentage of target killing and (d) IFN-γ production after 24 h of co-culture of the indicated FACS-sorted effector populations with the parental and B2M KO target cells. (e) Histograms showing B7H6 expression on the surface of parental MCF7.B7H6 cells (isotype control in gray) and HLA-A2 expression on parental and B2M KO MCF7.B7H6 cells. (f) IFN-γ production after 24 h co-culture of the indicated FACS-sorted effector populations with parental and B2M KO cells. n > 3 independent experiments, mean±SEM. *P < .05, **P ≤ 0.01, ns, not significant, unpaired Students t-test (comparison with HER2TCR−NKp30− T cell population). (g) SKMel37.B7H6 MHC-class I negative (red) and MHC-class I positive (green) cells were pre-labeled with cytoplasmic labeling dyes (CytoLight rapid reagents, Incucyte®) and mixed at a 1:1 ratio in microscopy chamber wells. Effector cells were added at a 3:1 ratio and the cells were co-cultured for 24 h at 37ºC. Pie-charts indicate % of red or green cells remaining after co-culture with the different effector cells. Images were acquired with a Leica SP5 microscope. Representative fields were selected from a combined full-well image obtained with a tile-scan using Leica software. Images were analyzed using ImageJ/Fiji software
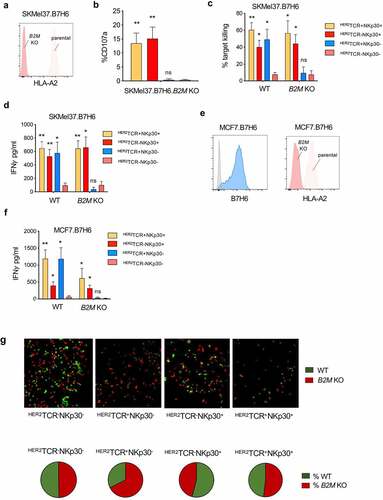
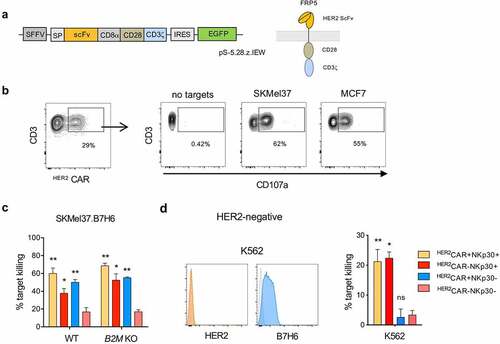
Figure 5. HER2CAR+NKp30+CD8+ T cells can eliminate tumor cells expressing or lacking HER2 using dual recognition modes. CD8+ T cells were expanded in the presence of αCD3/CD28 and IL-15 for 3 days, transduced with lentiviral particles encoding the HER2-CAR and then cultured with IL-15 for 12 more days. (a) Simplified schematic representation of the CAR construct with an extracellular HER2-specific scFv antibody domain, a CD8α hinge region, transmembrane and intracellular domains of CD28 and the intracellular domain of CD3ζ, followed by an internal ribosome entry site (IRES) and an enhanced green fluorescent protein sequence (EGFP). (b) Expression of the HER2CAR on CD8+ T cells upon transduction based on GFP expression (left). Dot-plots showing degranulation after co-culture with HER2-expressing target cells (right). (c) Percentage of target killing after 24 h of co-culture of the indicated effector populations with parental SKMel37.B7H6 parental and B2M KO target cells. (d) Histograms showing HER2 and B7H6 expression on the surface of K562 cells (isotype control in gray) (left). Percentage of target killing after 24 h of co-culture of the indicated effector populations with K562 cells (right). n > 3 independent experiments, mean±SEM. *P < .05, **P ≤ 0.01, ns, not significant, unpaired students t-test (comparison with HER2CAR−NKp30− T cell population)