
Figures & data
Figure 1. APOBEC3B expression was elevated in GC and correlated with tumor progression. a, Correlation between APOBEC family members and the fraction of copy number altered genome. Spearman rank test, *P < .05, **P < .01, ***P < .001, ns refers to not significant. b, Representative IHC staining of APOBEC3B in GC intratumor and peritumor tissues. APOBEC3B positive cells were stained by brown. Original magnification: × 200. c, Bar chart displayed the distribution of intratumoral (blue) and peritumoral (red) APOBEC3B IHC scores (n = 482). Paired t test P < .001. d, APOBEC3B expression in gastric cancer positively correlated with TNM stage. One-way ANOVA followed by Tukey multiple comparisons, *P < .05, **P < .01, ***P < .001, ns refers to not significant. e, Tumor mutation burden defined as non-silent mutations per Mb was elevated in APOBEC3B-enriched patients. Mann–Whitney U test, *P < .05, **P < .01, ***P < .001, ns refers to not significant. All presented P values were two-tailed
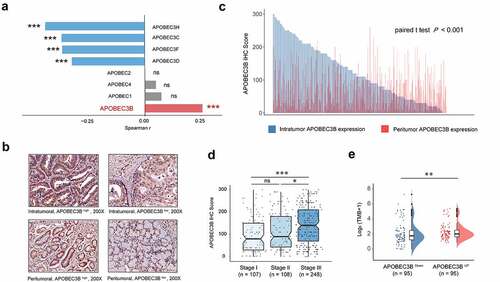
Table 1. Univariate and multivariate analysis for clinicopathological parameter in GC
Figure 2. Elevated expression of APOBEC3B predicted poor prognosis in GC. Four hundred and eighty-two patients in ZSHS Cohort were randomly divided into discovery set (n = 242) and validation set (n = 240). a-d, Kaplan–Meier curves indicated poor OS and DFS in patients with APOBEC3B-enriched tumors from discovery set (a, b) and validation set (c, d). e, Forest plot to show hazard ratio (HR) and 95% confidential interval (CI) of APOBEC3B expression in different TNM stages. Elevated APOBEC3B indicated poor OS in TNM stage II patients in both ZSHS Cohort and TCGA Cohort. All P values were two-sided
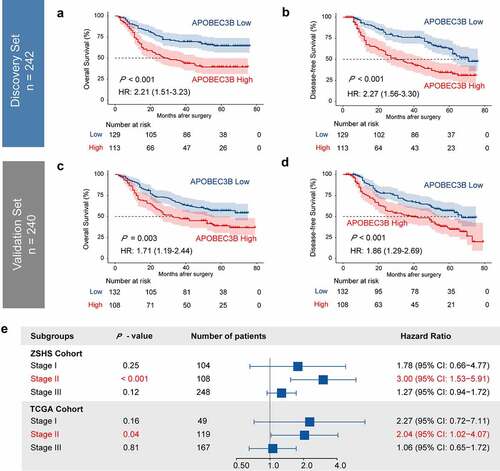
Figure 3. APOBEC3B indicated decreased infiltration of CD8+ T cells in GC. a, The comprehensive immune contexture containing 16 kinds of immune cells was generated by CIBERSORT. Accumulated M0 polarized macrophages whereas decreased CD8+ T cells and CD4+ T cells were observed in APOBEC3B-enriched tumors. b, Flow cytometry analysis detected a trend toward negative association between CD8+ T cells proportion and APOBEC3B. c, Kaplan–Meier curves demonstrated that the infiltration of CD8+ T cells only indicated prolonged OS in APOBEC3B-enriched subgroups. d, Heatmap displayed associations between APOBEC3B expression and CD8+ T cell activation or exhaustion scores. CD8+ T cell phenotypic scores were calculated as corresponding mRNA level divided by CD8A expression. e, Flow cytometry detected the phenotype of CD8+ T cells in APOBEC3B-enriched tumors. Statistical analysis was performed with unpaired t test, *P < .05, **P < .01, ***P < .001. All shown P values were two-tailed
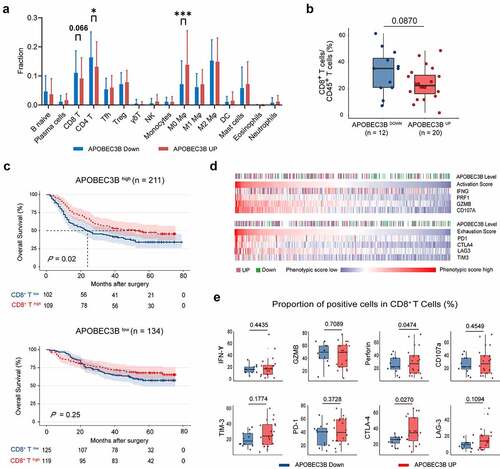
Figure 4. Association between APOBEC3B expression and therapeutic responsiveness in gastric cancer. A, For stage II or III patients (n = 345), Kaplan–Meier curves with univariate Cox analysis displayed responsiveness to fluorouracil-based adjuvant chemotherapy (ACT) in subgroups stratified by APOBEC3B expression. B, Forest plots showed the prognostic impact of ACT in different subgroups. Univariate Cox analysis was applied. ACT prolonged overall survival of TNM stage II GC patients with APOBEC3B enrichment (P = .017, HR: 0.32), and GC patients in TNM stage III (P < .001, HR: 0.33). Receiving ACT did not significantly impact OS in TNM stage II GC patients with low APOBEC3B expression (P = .902, HR: 1.08) C, Waterfall plot showed responsiveness to pembrolizumab according to APOBEC3B expression (unpaired t test). PR: partial response, CR: complete response, SD: stable disease, PD: progressive disease. *P < .05, **P < .01, ***P < .001, ns refers to not significant. All presented P values were two-tailed
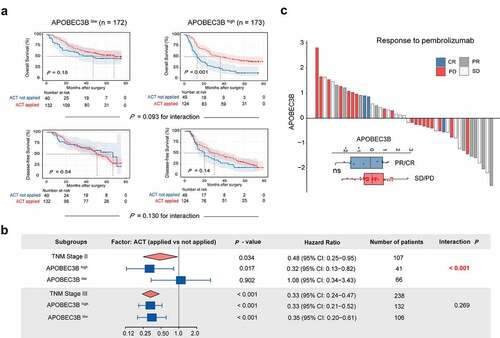
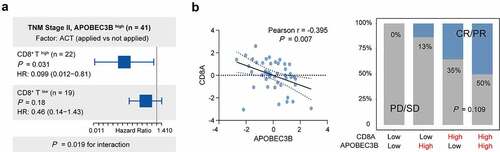
Figure 5. Association between CD8+ T infiltration and therapeutic responsiveness in GC with APOBEC3B enrichment. a, In TNM stage II GC with APOBEC3B enrichment, the infiltration of CD8+ T affected the clinical significance of ACT. For patients with high CD8+ T cells, application of ACT indicated superior OS (P = .031, HR: 0.099). However, the survival benefit of ACT was not statistically significant in GC with CD8+ T low infiltration (P = .18, HR: 0.46). b, In ICB Cohort, APOBEC3B negatively correlated with CD8A (Pearson r = −0.395, P = .007). The cutoff values of APOBEC3B and CD8A were both zero. Patients in APOBEC3B and CD8A double-high subgroup held the largest population of ICB responder (CR or PR, 50%). Only 13% of patients in APOBEC3B high CD8A low subgroup showed response to ICB. Chi-square test P = .109. All presented P values were two-tailed
Supplemental Material
Download ()Availability of data and materials
Clinical and genomic data from the Cancer Genome Atlas (TCGA-STAD) were downloaded from http://www.cbioportal.org and https://xenabrowser.net/. Somatic mutation data of TCGA-STAD Cohort was downloaded from https://portal.gdc.cancer.gov/. Clinical and genomic data of GSE62254 (ACRG Gastric Cohort) were downloaded from https://www.ncbi.nlm.nih.gov/geo/query/acc.cgi?acc=GSE62254. Clinical and genomic data from the ICB cohort were downloaded from http://tide.dfci.harvard.edu/download/. Data from ZSHS Cohort are available from the corresponding author upon reasonable request.