Figures & data
Figure 1. Gemcitabine increases NK cell activating ligand and death receptor expression on OC cells. Phenotype of OC cell lines SKOV-3 (white), IGROV-1 (light gray) and OVCAR-3 (gray) treated with gemcitabine for 48 h (all n = 4). Delta Geometric Mean Fluorescence Intensity (ΔMFI) was determined based on the same sample stained with a live/dead dye only. Protein expression (mean + SD) of NKG2D ligands (a) MICA/B, (b) ULBP1, (c) ULBP2/5/6, (d) ULBP3, DNAM-1 ligands (e) CD112 (Nectin-2), (f) CD155 (PVR), and death receptors (g) CD261 (TRAIL-R1), (h) CD262 (TRAIL-R2), and (i) CD95 (Fas) is shown. Statistical significances were evaluated per cell line by One-way ANOVA with Bonferroni correction
Figure 2. Gemcitabine does not negatively impact HPC-NK cell phenotype and functionality. A-K. Phenotype of HPC-NK cells treated with gemcitabine for 48 h. Percentage positivity corrected for background staining in the corresponding control sample is shown. Control samples did not contain the antibodies of interest. Protein expression of (a) NKG2A on viable CD56+CD3− cells, or (b) CD158b, (c) CD158e1, (d) NKp30, (e) NKp44, (f) NKp46, (g) DNAM-1, (h) NKG2D, (i) CD69 (all n = 3) on viable CD56+CD3−NKG2A+ cells, or (j) FasL, (k) TRAIL (both n = 3) on living CD56+ cells is shown. L-N. Functionality of HPC-NK cells treated with gemcitabine for 48 h, after 4 h stimulation with (white) or without (black) K562 (all n = 3). Percentage positivity as protein expression of (l) perforin on viable CD56+ cells, (m) CD107a (degranulation) and (n) IFNγ on viable CD56+ perforin+ HPC-NK cells is shown. Graphs show individual donors (NK1-6). Statistical significance was tested by repeated-measures One-way ANOVA for A-K and repeated-measures Two-way ANOVA for L-N, all ANOVAs with Bonferroni correction
Figure 3. Pre-treatment of SKOV-3 cells with gemcitabine does not improve HPC-NK cell functionality. A-B. Phenotype of SKOV-3 pre-treated with or without 8.8 nM gemcitabine for 48 h in a representative experiment. Overlay of (a) ULBP2/5/6 and (b) CD112 (nectin-2) expression is shown. The control sample contained a live/dead dye only. The numbers on the left show the median fluorescence intensity (MFI), the numbers on the right the delta MFI (ΔMFI), which was determined based on the control sample. C-F. Functionality of HPC-NK cells after 4 h stimulation with SKOV-3 cells pre-treated 48 h with or without 8.8 nM gemcitabine (GEM, n = 2). C-D. Percentage positivity of (c) CD107a (degranulation) and (d) IFNγ expression on living CD56+ perforin+ HPC-NK cells is shown in the absence or presence of an isotype control antibody, DNAM-1 and/or NKG2D blocking antibody. E-F. Percentage inhibition of (e) CD107a (degranulation) and (f) IFNγ positivity by blocking antibodies relative to isotype after 4 h stimulation with pre-treated (8.8 nM GEM) or untreated (0 nM GEM) SKOV-3 cells. Graphs show NK cell donors (NK8-9) with mean in panel C-F. Statistical significance was tested for C-F by repeated-measures Two-way ANOVA with Bonferroni correction
Figure 4. HPC-NK cells and gemcitabine additively kill OC cells in vitro. (a) Cell killing of OC cell lines (SKOV-3, white; IGROV-1, light gray; OVCAR-3, gray) or HPC-NK cells (dark gray) 48 h after gemcitabine incubation (n = 3). B-C. (b) SKOV-3 or (c) IGROV-1 cell killing 48 h after treatment with gemcitabine and/or HPC-NK cells (no HPC-NK cells, white; effector-to-target (E:T) ratio 0.3:1, light gray; 0.6:1/0.4:1, respectively, gray) (n = 3, n = 3–5, respectively). The stars above lines refer to significant differences as compared to no NK cells at the same gemcitabine concentration, the stars above bars reflect significant differences as compared to no gemcitabine at the same E:T ratio (ref). D-G. Fold change in HPC-NK cell (d-e) IFNγ (both n = 3), and (f-g) granzyme B (n = 2–3 and n = 3, respectively) secretion 48 h after co-culture with gemcitabine and (d, f) SKOV-3 or (e, g) IGROV-1 at an E:T ratio of 0.3:1 (light gray), or 0.6:1/0.4:1, respectively (gray) compared to 0 nM gemcitabine for each E:T ratio. (h) Cell killing of primary patient-derived OC cells ASC 009 72 h after gemcitabine incubation (one experiment, triplicates). (i) ASC 009 cell killing 72 h after treatment with gemcitabine and/or HPC-NK cells (no HPC-NK cells, white; E:T ratio 0.15:1, light gray; 0.3:1, gray; 0.6:1, dark gray) (n = 3 NK cell donors). The stars above lines refer to significant differences as compared to no NK cells at the same gemcitabine concentration, the stars above bars reflect significant differences as compared to no gemcitabine at the same E:T ratio (ref). Graphs show mean + SEM for A-G, I and mean + SD for H. Statistical significance was determined by (a) repeated-measures One-way ANOVA per cell type, (b and i) repeated-measures Two-way ANOVAs, (c) Two-way ANOVAs, (h) One-way ANOVA (all ANOVAs with Bonferroni correction), (f) a Kruskal–Wallis test with Dunn’s correction per E:T ratio, and (d-e and g) a Friedman test with Dunn’s correction per E:T ratio
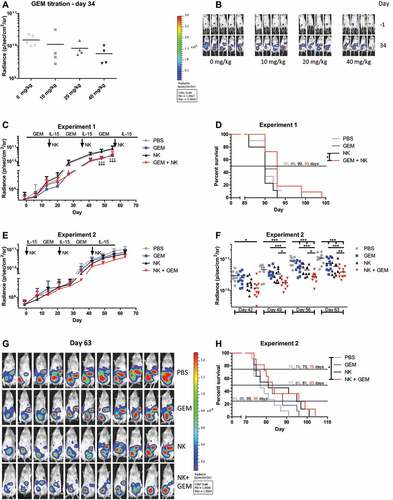
Figure 5. HPC-NK cells and gemcitabine additively decrease OC growth in SKOV-3 bearing NSG mice. (a) Radiance (photons/second/cm2/steradian) of tumors on day 34 after starting treatment (4–5 mice per group, excluding mice that did not show tumor growth over time) in SKOV-3 bearing NSG mice (0.2x10⁶ tumor cells injected i.p. at day −4) treated i.p. with 0 (PBS), 10, 20 or 40 mg/kg gemcitabine (GEM) twice weekly for two weeks followed by one week rest (one cycle) for two cycles. (b) BLI images from the experiment depicted in panel A on day −1 (1 day before treatment) and day 34 after starting treatment. (c) Radiance (photons/second/cm2/steradian) of tumors over time (7–11 mice per group, excluding mis-injections) in SKOV-3 bearing NSG mice (0.2 million tumor cells injected i.p. 4 days before treatment) treated i.p. with PBS (control, gray) or 40 mg/kg gemcitabine (blue) for three cycles, HPC-NK cells together with rhIL-15 cytokine support (black) or a combination of gemcitabine, HPC-NK cells and rhIL-15 (red). HPC-NK cells and rhIL-15 were administered once or every other day, respectively during the weeks the mice were off gemcitabine. After the last HPC-NK cell injection, rhIL-15 was given for two weeks. All mice could be followed for tumor growth until day 55 due to saturation. (d) Survival of mice from the experiment depicted in panel C. Mice that were sacrificed solely due to a subcutaneous tumor >1000mm3 (n = 6/44) were censored in the survival analysis. E-F. Radiance (photons/second/cm2/steradian) of tumors over time (11 mice per group) in SKOV-3 bearing NSG mice (0.2 million tumor cells injected i.p. 4 days before treatment) treated i.p. with PBS (control, gray), 40 mg/kg gemcitabine for two cycles (blue), HPC-NK cells together with rhIL-15 cytokine support (black), or a combination of HPC-NK cells, rhIL-15 and gemcitabine (red). HPC-NK cells and rhIL-15 were administered (starting) one week before the first gemcitabine cycle and during the weeks the mice were off gemcitabine, once or every other day per week, respectively. After the last HPC-NK cell injection, rhIL-15 was given for two weeks. All mice could be followed for tumor growth until day 63 due to saturation. Statistics was performed on data from panel E and significant differences are shown in panel F. (g) BLI pictures from the experiment depicted in panels E-F on day 63 after starting treatment. (h) Survival of mice from the experiment depicted in panels E-G. Mice that were sacrificed solely due to a subcutaneous tumor >1000mm3 (n = 2/44) were censored in the survival analysis. Graphs show mean + SD for C and E. Statistical significance was tested for A by one-way ANOVA, for C by two-way ANOVA, for E (shown in F) by repeated-measures two-way ANOVA (all ANOVAs with Bonferroni correction), and for D and H by Cox regression analysis