Figures & data
Table 1. Biological, clinical and evolutionary features of patients
Figure 1. Immunophenotype analysis after in vitro stimulation with anti-CD3/CD28. (a) Gaiting strategy consisted in the following steps: selecting total lymphocytes in an FSC/SSC dot plot, selecting singlets in an FSC-A/FSC-H dot plot, selecting 7-AAD negative and positive alive and dead cells in a dot plot 7-AAD/NKG2D, and selecting CD8+ T cells in a CD8/CFSE dot plot and then logical gating to identify singlet alive and dead CD8+ T cells. Histogram gates were set in CFSE to identify cells in the zero, first, second, third, fourthor fifth proliferation cycle for alive cells, and in the zero or >1 cycle for dead cells. (b) Dot plots showing CFSE staining in the FITC channel versus the other 11 fluorescences with CD8-BV605, CD226-PE, CD25-PECy7, CD27-APC, CD38-AF700, NKG2D-APCCy7), TIGIT-BV421, CD45RA-BV510, TIM-3-BV711 and NKG2A-BV786
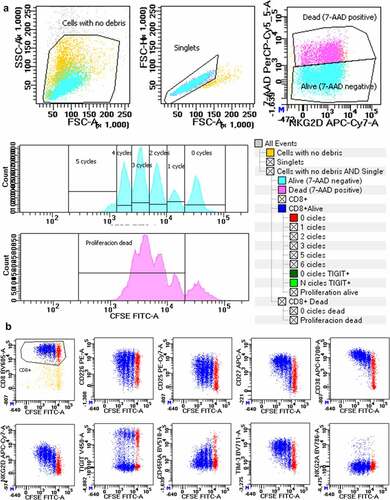
Figure 2. CD226 expression is up-modulated on NK and T cells in presence of specific inhibitory-receptor/ligand interactions. (a) Mean fluorescence intensity (MFI) of CD226 in CD56dim and CD56bright NK cells and CD8+ T cells (upper plots) and in KIR2DL1+, KIR2DL2/L3+ and KIR3DL1+ NK cell subsets (lower plots) in presence of HLA C1, C2 or Bw4 ligands and −21 M/T dimorphism. P values indicate global estimation in the ANOVA test; * p < .05, ** p < .01, and *** p < .001 in the post hoc tests for each group. (b) Contingency tables for C1, C2 and Bw4 HLA-I ligands versus −21 M/T dimorphism in controls and cancer patients. P values estimated in the χ2 test
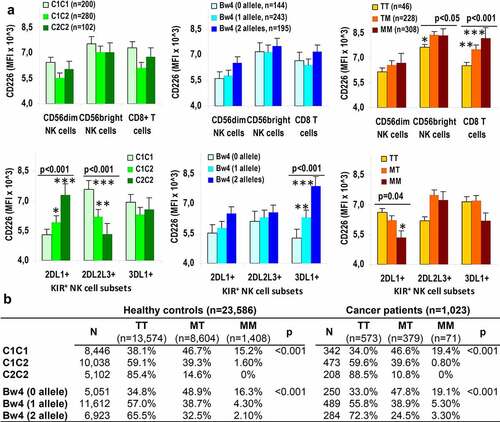
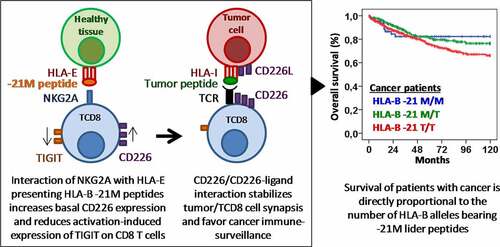
Figure 3. Methionine −21 of the HLA-B leader peptide is associated with longer survival in patients with different types of cancer. (a) Kaplan–Meier and log-rank test for overall survival according to the genotype TT, MT or MM of the position −21 of the HLA-B leader peptide in all cancer patients and in patients with solid cancer (melanoma, bladderand ovarian cancer), plasma cell neoplasms and child acute leukemia. Ten-year overall survival rate (10yOS) is indicated for each group of patients. (b) Cox regression analysis of overall survival for sex, age, type of cancer, HLA-B −21 M/T dimorphism, and C1, C2, and Bw4 HLA-ligands
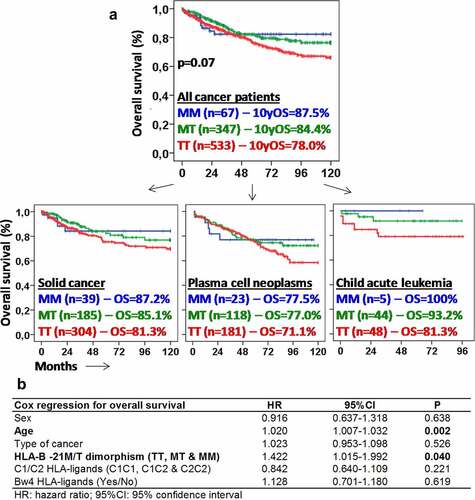
Figure 4. Methionine −21 is associated with higher proliferation and lower expression of TIGIT after anti-CD3/CD28 stimulation of CD8+ T cells. (a) Percentage of proliferative CD8+ T cells after anti-CD3/CD28 in vitro stimulation according to the −21 M/T genotype in total cells (left) or in cells within the proliferative cycles (right). Cells for each donor were assayed in triplicate and results are shown as mean±SEM. (b) Mean fluorescence intensity (MFI) of TIGIT on CD8+ T cells in similar conditions as in A. (c) Expression (MFI) of CD8, CD25, CD27, CD38, CD45RA, CD226, NKG2A, NGK2D TIM3, and CD45RA in total CD8+ T cells after in vitro stimulation with anti-CD3/CD28. (d) Expression (MFI) of CD45RA and NKG2D on CD8+ T cells within the proliferative cycles. * < 0.05, ** < 0.01and *** < 0.001 in the ANOVA and post hoc tests comparing each MM, MTor TT donors with the other two groups
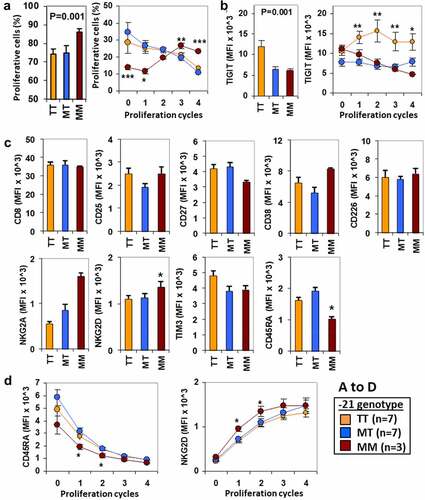
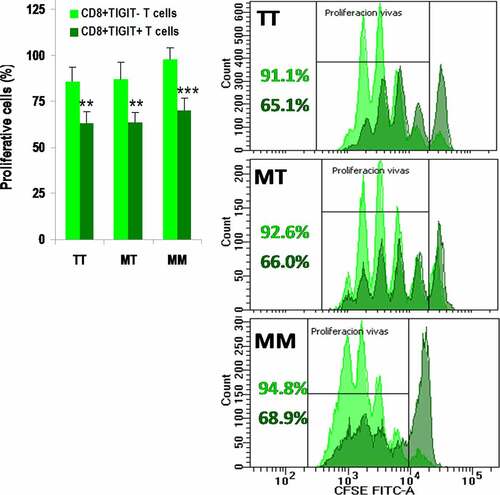
Figure 5. TIGIT suppresses proliferation of CD8+ T cells after anti-CD3/CD28 stimulation. Percentage of proliferative cells within CD8+TIGIT− (light green) and CD8+TIGIT+ (dark green) T cells after anti-CD3/CD28 in vitro stimulation, according to the −21 M/T genotype. Cells for each donor were assayed in triplicate and results are shown as mean±SEM. ** < 0.01 and *** < 0.001 in the Student’s t test comparing CD8+TIGIT− and CD8+TIGIT+ T cells. Representative proliferation histograms are shown for each genotype