Figures & data
Figure 1. Increasing Vγ2Vδ2 T cell numbers or changing the route of transfer does not improve immunity against human PC-3 prostate tumors in immunodeficient NSG mice. (a) Schema of treatment protocol used to evaluate the anti-tumor efficacy of Vγ2Vδ2 T cells. Human PC-3 prostate cancer cells were injected s.c. into immunodeficient NSG mice on day 0. On day 13, pamidronate (50 μg/kg) was given i.v. On day 14, cryopreserved purified Vγ2Vδ2 T cells expanded using pulse zoledronate stimulation were inoculated i.v. or i.p. Treatments were repeated weekly until week 6. Longitudinal and transverse diameters of the tumors were measured weekly. (b) (left panel) Increasing the number of cryopreserved Vγ2Vδ2 T cells does not improve anti-tumor immunity. Mean PC-3 tumor volume ± SD is shown for 3–8 mice per group treated with either pamidronate alone (closed circles), or pamidronate with 1 × 10⁶ (open circles), 31 × 106 (open triangles), or 62 × 106 (open inverted triangles) purified Vγ2Vδ2 T cells. (right panel) Tumor volumes at week 6 for individual mice. Bars represent mean values. (c) (left panel) Changing the route of adoptively transferred Vγ2Vδ2 T cells does not improve anti-tumor immunity. Mean PC-3 tumor volume ± SD is shown for 5–6 mice per group treated with either pamidronate alone (closed circles), or pamidronate with 1 × 10⁶ purified Vγ2Vδ2 T cells given i.v. (open circles) or i.p. (open triangles). (right panel) Tumor volumes at week 7 for individual mice. Bars represent mean values. *p < .05, **p < .01, ***p < .001 compared with the tumor volume in mice treated with pamidronate alone using the Mann-Whitney U test
Figure 2. Vγ2Vδ2 T cells express inhibitory receptors after bisphosphonate stimulation. (a) Inhibitory receptors are expressed on Vγ2Vδ2 T cells during in vitro expansion. PBMC from a normal donor were pulsed for 4 h with 100 μM zoledronic acid, washed, and then cultured in C-media with IL-2 for 14 days to expand Vγ2Vδ2 T cells. Surface expression of various inhibitory receptors was assessed by flow cytometric analysis at the times indicated. (b) PD-1 inhibitory receptors are re-expressed on Vγ2Vδ2 T cells after stimulation by bisphophonate-treated PC-3 prostate cancer cells. Mitomycin C-treated PC-3 cells were cultured overnight with 200 μM pamidronate, washed, and then cultured with thawed purified Vγ2Vδ2 T cells in C-media with IL-2 for 10 days. Surface expression of inhibitory receptors was assessed by flow cytometric analysis at the times indicated, analyzed using FloJo software, and plotted with bi-exponential scaling. N.D. = not determined. Solid histograms show the specific antibody staining while open histograms show control mAb staining
Figure 3. PC-3 prostate cancer cells express PD-L1, PD-L2, and other receptor ligands. PC-3 cancer cells were cultured in F12K medium for at least one passage and then washed and reacted with various mAbs. Surface expression was then assessed by flow cytometry, analyzed using FloJo software, and plotted with bi-exponential scaling. Solid histograms show the specific antibody staining while open histograms show control mAb staining
Figure 4. Co-culture with activated Vγ2Vδ2 T cells increases surface expression of PD-L1 on PC-3 cells through a soluble cytokine. PC-3 cells were cultured overnight with or without pamidronate (200 μM) and then washed twice. Treated PC-3 cells were cultured with or without purified Vγ2Vδ2 T cells in either the inner or outer wells in a Transwell plate separated by a 0.4 μm membrane under the indicated conditions for 48 h. PC-3 cells in the outer well were harvested, stained with anti-PD-L1 mAb, and the surface expression of PD-L1 assessed by flow cytometry. Culture supernatants were harvested after 48 h and assayed for IFN-γ levels by ELISA. (a) PD-L1 expression by PC-3 cells cultured under the indicated conditions. Representative of two experiments. Solid histograms show the specific antibody staining while open histograms show control mAb staining. (b) Expression of PD-L1 (MFI) on PC-3 cells in the outer well and supernatant IFN-γ levels after co-culture with Vγ2Vδ2 T cells and PC-3 cells (either untreated or treated with pamidronate) for 48 h
Figure 5. IFN-γ and IFN-α increase the surface expression of PD-L1 on PC-3 prostate cancer cells. PC-3 cells were treated with IFN-γ or IFN-α at the indicated concentrations for 48 h. Cells were then stained with various mAbs and surface expression of BTN3, PD-1, PD-L1, and PD-L2 assessed by flow cytometric analysis. (a) Representative histograms of surface expression of various proteins by PC-3 cells cultured under the indicated conditions. Representative of two experiments. Solid histograms show the specific antibody staining while open histograms show control mAb staining. (b) Expression of PD-L1 (MFI) on PC-3 cells after treatment with IFN-γ or IFN-α for 48 h
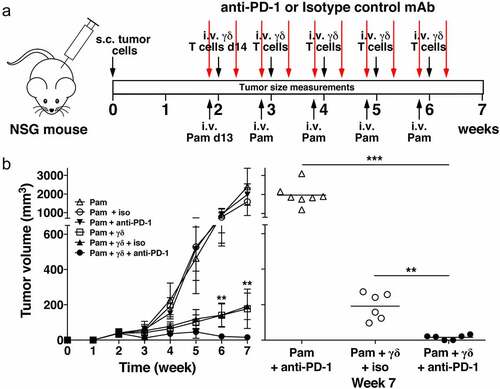
Figure 6. PD-1 checkpoint blockade enhances immunity by adoptively transferred Vγ2Vδ2 T cells against PC-3 prostate tumors. (a) Schema of treatment protocol used to evaluate the anti-tumor efficacy of Vγ2Vδ2 T cells with PD-1 checkpoint blockade. Human PC-3 prostate cancer cells were injected s.c. into NSG mice on day 0. On day 13, pamidronate (50 μg/kg) was given i.v. with either an anti-PD-1 or an isotype control mAb (200 μg/mouse) injected i.p. On day 14, 1 × 10⁶ purified Vγ2Vδ2 T cells were inoculated i.v. Two days later, mAb injections were repeated. Treatments continued until week 6. Longitudinal and transverse diameters of the tumors were measured weekly. (b) (left panel) Combination of PD-1 checkpoint blockade and adoptive transfer of Vγ2Vδ2 T cells significantly reduces prostate tumor volume in NSG mice compared with adoptive transfer only. Mean PC-3 tumor volume ± SD is shown for 6–8 mice per group treated with either pamidronate alone (open triangles), pamidronate with purified Vγ2Vδ2 T cells (open squares), pamidronate with control mAb (open circles), pamidronate with anti-PD-1 mAb (closed inverted triangles), pamidronate with purified Vγ2Vδ2 T cells and control antibody (closed triangles), or pamidronate with purified Vγ2Vδ2 T cells and anti-PD-1 mAb (closed circles). **p < .01, mean tumor volume of mice treated with anti-PD-1 mAb and adoptive transfer of Vγ2Vδ2 T cells versus adoptive transfer of Vγ2Vδ2 T cells alone using the Mann-Whitney U test. (right panel) Tumor volume at week 7 of individual mice treated with pamidronate and anti-PD-1 mAb (open triangles), pamidronate with purified Vγ2Vδ2 T cells and control mAb (open circles), or pamidronate with purified Vγ2Vδ2 T cells and anti-PD-1 mAb (closed circles). Bars represent mean values. **p < .01, ***p < .001 using the Mann-Whitney U test