
Figures & data
Table 1. Characteristics of PD-L1 promoter locus in the LARC patients who received preoperative CCRT
Figure 1. Radiotherapy triggered PD-L1 upregulation via autonomous IFNβ-mediated signaling pathway. (a) The gene expression data were downloaded from GSE93375 database. The type I IFN signatures were analyzed for heatmap (pre-CCRT:13 CRC patients; post-CCRT:9 CRC patients). (b) The correlation between type I IFN signatures (CXCL9, CXCL10, IFI27, IFI44, ISG15 and ISG20) and PD-L1 (CD274) were analyzed (n = 438, colon adenocarcinoma, TCGA) (c) Tumor IFNβ expression was significantly upregulated by CCRT (H-score, n = 130, p < .001). Tumor PD-L1 expression was also significantly upregulated by CCRT (H-score, p < .001). Tumor IFNβ expression was correlated with PD-L1 expression in post-CCRT surgical tissues (p = .0125). (d) SW480 and SW620 cells were treated with conditioned medium (CM) from irradiated cells (48 hrs post-irradiation) for 24 hrs and analyzed by immunoblotting. The quantification of these results is shown (n = 3). *p < .05 and **p < .01. (e) The neutralizing antibodies against IFNα and IFNβ were added into conditioned medium from irradiated SW480 and HCT116. Then SW480/HCT116 were treated with these conditioned medium for 24 hrs and analyzed qRT-PCR, respectively. (f) SW480 and CT26 cells were treated with IFNβ for 24 hrs and then examined by immunoblotting. (g) SW480 cells were treated with IFNβ for 24 hrs and then examined by qRT-PCR. The quantification of these results is shown on the right (n = 3). **p < .01 and ***p < .001. These data were obtained from three independent experiments, and the values represent the mean ± SEM. (F) CT26 cells were treated with IFNβ, STAT1 inhibitor (5 μM fludarabine) and IFNAR1 inhibitor (2 μM IFNAR1-IN) for 24 hrs and then analyzed by immunoblotting and flow cytometry
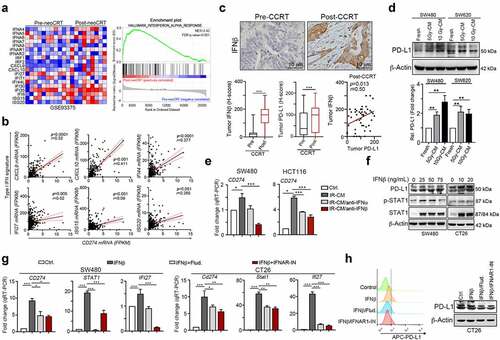
Figure 2. Methylation on PD-L1 promoter loci was clinically associated with the response to CCRT and survival outcome in LARC patients
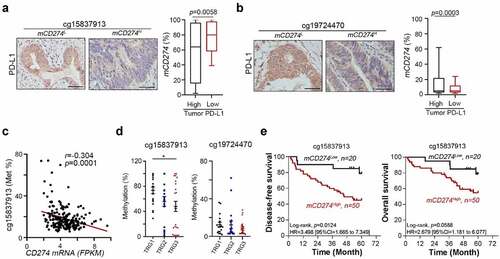
Table 2. Univariate and multivariate analysis of PD-L1 promoter loci (cg15837913 and cg19724470) in locally advanced colorectal cancer who received preoperative CCRT
Figure 3. Methylation on cg15837913 constrains PD-L1 upregulation in response to radiotherapy (a) The status of tumor IFNβ within tumor microenvironment in post-CCRT surgical tissues. In high tumor IFNβ group, there was 31.1% patients with mCD274L (cg15837913 loci) after CCRT treatment. Moreover, all mCD274L patients with high tumor PD-L1 expression. (b) SW480 cells were treated with DNMT inhibitor (DAC, 1–2 μM) for 48 hrs. The methylation status on two loci (cg15837913 and cg19724470) were analyzed by pyrosequencing (n = 3). (c) SW480 and CT26 cells were treated with DNMT inhibitor (2 μM DAC) and IR (2 Gy) for 48 hrs and analyzed by immunoblotting. The quantification of these results is shown (n = 3). *p < .05, **p < .01 and ***p < .001. (d) SW480 and CT26 cells were treated with DNMTi (2 μM DAC) and IR (2 Gy) for 48 hrs and analyzed by flow cytometry. The quantification of these results is shown (n = 3). *p < .05, **p < .01 and ***p < .001
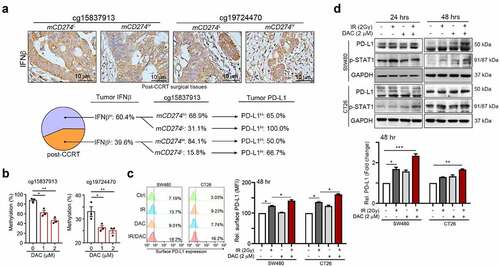
Figure 4. Inhibition of DNMT1 remarkably inhibited IR-induced PD-L1 upregulation and immunogenicity via IFNβ/IFNAR1/STAT1 signaling (a) CT26 cells were treated with DAC (5 μg/mL) and IR (2 Gy) for 48 hrs, and gene expression was examined by qRT-PCR. The quantification of these results is shown (n = 3). **p < .01 and ***p < .001. (b) SW480 cells were treated with DAC (5 μg/mL) and IR (2 Gy) for 48 hrs, and gene expression was examined by qRT-PCR. The quantification of these results is shown (n = 3). **p < .01 and ***p < .001. (c) The supernatant of SW480 cells after treatment with DAC (5 μg/mL) and IR (2 Gy) for 48 hrs, and the level of IFNβ was evaluated by ELISA and immunoblotting (n = 3). *p < .05 and **p < .01. (d) SW480 and CT26 cells were treated with DAC (2 μM DAC) and IR (2 Gy) for 24 hrs, treated with STAT1 inhibitor (10 μM) and IFNAR1 inhibitor (10 μM) for 24 hrs. The conditioned medium (CM) was added into fresh SW480 and CT26 cells for 24 hrs, and then analyzed by flow cytometry. (e) SW480 and CT26 cells were treated with DAC (2 μM DAC) and IR (2 Gy) for 24 hrs, treated with the STAT1 inhibitor fludarabine (10 μM) and the IFNAR1 inhibitor IFNAR1-IN (10 μM) for 24 hrs. The conditioned medium (CM) was added into fresh SW480 and CT26 cells for 24 hrs, and then analyzed by immunoblotting. These data were obtained from three independent experiments, and the values represent the mean ± SEM
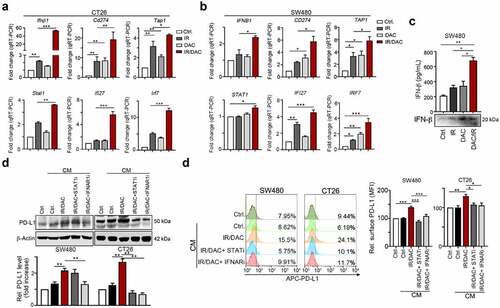
Figure 5. AZA synergistically increased the therapeutic response to radiotherapy in vivo. (a) Tumor-bearing BALB/c mice (n = 6) were treated with AZA (0.5 mg/kg, i.p. injection), CCRT [5-FU (5 mg/kg, i.p. injection) and IR (5 Gy)] at the indicated times shown on the timeline. Tumor volume was measured and calculated every 3 days. The quantification of these results is shown (n = 6). **p < .01 and ***p < .001. (b) Resected tumors from representative mice were collected for lysis and analyzed by immunoblotting. The quantification of these results is shown (n = 3). *p < .05, **p < .01 and ***p < .01. (c) The infiltration of CD3+ and CD8+ immune cells in resected tumors from representative mice were analyzed by immunohistochemistry. Bar: 50 μm. (d) The quantification of these results is shown (n = 5). *p < .05, **p < .01 and *** p < .001
![Figure 5. AZA synergistically increased the therapeutic response to radiotherapy in vivo. (a) Tumor-bearing BALB/c mice (n = 6) were treated with AZA (0.5 mg/kg, i.p. injection), CCRT [5-FU (5 mg/kg, i.p. injection) and IR (5 Gy)] at the indicated times shown on the timeline. Tumor volume was measured and calculated every 3 days. The quantification of these results is shown (n = 6). **p < .01 and ***p < .001. (b) Resected tumors from representative mice were collected for lysis and analyzed by immunoblotting. The quantification of these results is shown (n = 3). *p < .05, **p < .01 and ***p < .01. (c) The infiltration of CD3+ and CD8+ immune cells in resected tumors from representative mice were analyzed by immunohistochemistry. Bar: 50 μm. (d) The quantification of these results is shown (n = 5). *p < .05, **p < .01 and *** p < .001](/cms/asset/16103803-9211-4888-a100-124e3d290e88/koni_a_1989790_f0005_oc.jpg)
Figure 6. DNMTi enhanced the therapeutic efficacy of concurrent chemoradiotherapy and anti-PD-L1 immunotherapy in CRC in vivo.(a) Resected tumors from representative mice were analyzed by RNA-seq (n = 2). The IFNβ-related signatures are shown (n = 2 per group). (b) The most enriched upregulated genes list (GO analysis) in CCRT and PBS group are shown (CCRT vs PBS and CCRT/ATZ vs PBS). (c) The result of GSEA (Gene Set Enrichment analysis) indicated that type I IFN signaling was activated in CCRT group compared to PBS group, and in CCRT/AZA group compared to PBS group. (d) The mRNA level of type I IFN signatures in the resected tumors were analyzed by qRT-PCR (n = 3–4). *p < .05, **p < .01 and ***p < .001. (e) Tumor-bearing BALB/c mice (n = 6) were treated with AZA (0.5 mg/kg, i.p. injection), CCRT [IR (5 Gy) and 5-FU (5 mg/kg, i.p. injection)] and anti-PD-L1 blockade (100 μg/mouse, i.p. injection) at the indicated times shown on the timeline. Tumor volume was measured and calculated every 3 days. The relative tumor volume is shown (n = 6). **p < .01 and ***p < .001. Mouse survival was assessed with Kaplan-Meier survival curves (n = 6)
![Figure 6. DNMTi enhanced the therapeutic efficacy of concurrent chemoradiotherapy and anti-PD-L1 immunotherapy in CRC in vivo.(a) Resected tumors from representative mice were analyzed by RNA-seq (n = 2). The IFNβ-related signatures are shown (n = 2 per group). (b) The most enriched upregulated genes list (GO analysis) in CCRT and PBS group are shown (CCRT vs PBS and CCRT/ATZ vs PBS). (c) The result of GSEA (Gene Set Enrichment analysis) indicated that type I IFN signaling was activated in CCRT group compared to PBS group, and in CCRT/AZA group compared to PBS group. (d) The mRNA level of type I IFN signatures in the resected tumors were analyzed by qRT-PCR (n = 3–4). *p < .05, **p < .01 and ***p < .001. (e) Tumor-bearing BALB/c mice (n = 6) were treated with AZA (0.5 mg/kg, i.p. injection), CCRT [IR (5 Gy) and 5-FU (5 mg/kg, i.p. injection)] and anti-PD-L1 blockade (100 μg/mouse, i.p. injection) at the indicated times shown on the timeline. Tumor volume was measured and calculated every 3 days. The relative tumor volume is shown (n = 6). **p < .01 and ***p < .001. Mouse survival was assessed with Kaplan-Meier survival curves (n = 6)](/cms/asset/7108cb37-fd1b-47ad-9c48-2e787c067519/koni_a_1989790_f0006_oc.jpg)