Figures & data
Figure 1. Expression and localization of CENPF in HCC cells and tissues. (a) qRT-PCR analysis of CENPF mRNA levels in five representative tumor and adjacent non-tumor tissue samples from HCC patients. Levels were normalized to GAPDH mRNA. (b) qRT-PCR (upper) and Western blot (lower) analysis of CENPF mRNA and protein expression, respectively, in the normal hepatic cell line QSG-7701 and six HCC cell lines. β-Actin was probed as a loading control. (c) Confocal fluorescence micrographs of CENPF localization (white arrows) in QSG-7701 and HCC cell lines. Red represents CENPF and blue represents nucleus revealed with DAPI (blue). **, p < .01
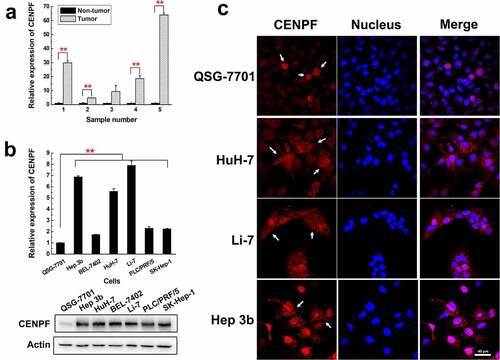
Figure 2. Tumor growth and CENPF autoantibody production in a mouse HCC model. (a) qRT-PCR (left) and western blot (right) analysis of CENPF mRNA and protein expression, respectively, in H22 cells stably expressing a control shRNA (WT) or CENPF-specific shRNA (KD). (b) Tumor volume in mice injected subcutaneously with H22 WT and KD cell lines. (c) Images of subcutaneous tumors excised on day 21 after H22 cell injection. (d) Weight (left) and appearance (right) of spleens from mice on day 21 after H22 cell injection. (e) Serum CENPF AAb level in mice on the indicated days after H22 cell injection. **, p < .01 vs. WT group. WT, wild type. KD, knockdown
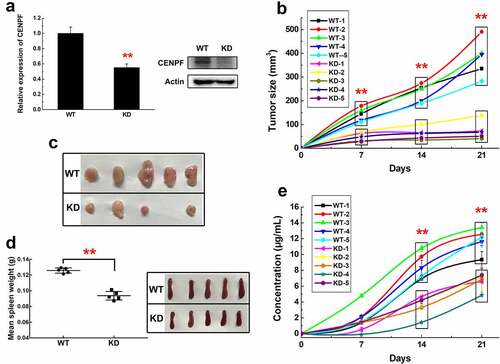
Figure 3. The effect of CENPF expression on HCC cell proliferation, apoptosis and necrosis. (a) Relative proliferation rate of H22 WT and KD cells during 4 d was measured by CCK-8. The apoptotic rate (b) or necrosis rate (c) of H22 WT and KD cells on day 2 or 4 were detected by flow cytometry. (d) Immunohistochemical staining of Ki-67, TUNEL staining and H&E staining of tumor biopsies obtained from mice injected subcutaneously with H22 WT or KD cells. Scale bar 50 μm. The rate of Ki-67 (e) or TUNEL (f) positive cells was calculated. The expression of proliferation related proteins in H22 cells (g) or tumors (h) with or without CENPF knockdown was analyzed by western blot. *, p < .05. **, p < .01. WT, wild type. KD, knockdown
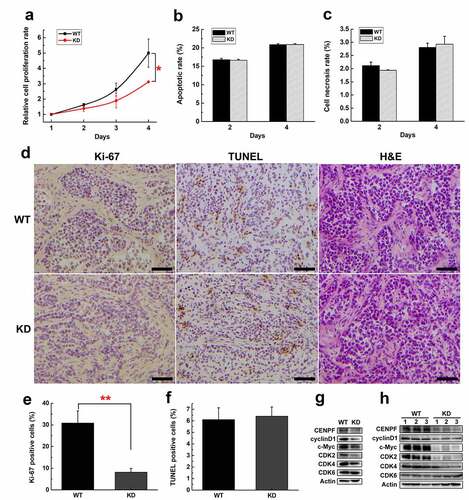
Figure 4. Apoptosis induced CENPF translocation and exposure in HCC cells. HuH-7 and Hep 3b cells were cultured under different serum starvation conditions (8%, 6%, 4%, 0% FBS respectively for 72 h), to induce apoptosis and then stained with Annexin V-FITC, PI, and CENPF antibody. (a, b) The CENPF positive rate of apoptotic cells, necrotic cells and normal cells was detected by flow cytometry (left), and the correlation of CENPF positive rate with apoptosis rate was analyzed (right). (c) Confocal images of apoptotic HCC cells stained with anti-CENPF antibody (red) showing CENPF redistribution into apoptotic vesicles (white arrows). Nuclei were stained with DAPI (blue)
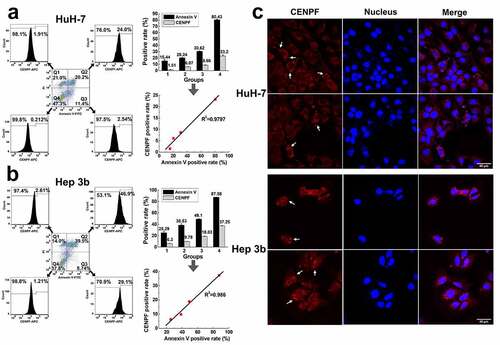
Figure 5. Distribution of DCs in HCC tumor tissues from patients or mice. Frozen sections of tumor and paratumor tissues from HCC patients (a) or mice injected with the murine H22 HCC cell line (b) were stained with anti-CD11c antibody and Alexa Fluor 488 conjugated secondary antibody (green) to detect DCs, counterstained with DAPI (blue) to reveal nucleus, and observed by confocal microscope. Scale bar 20 μm
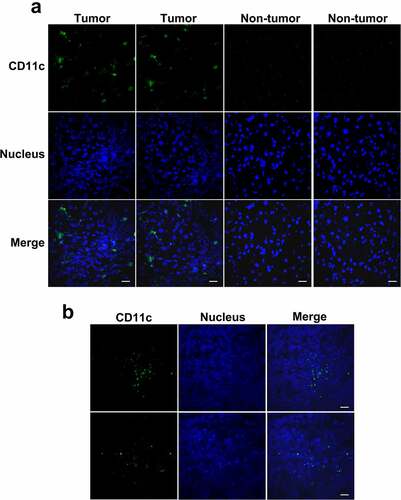
Figure 6. Phagocytosis and maturation of DCs induced by apoptotic cell components. (a) Flow cytometry (forward and side scatter) plots (left) and phase contrast micrographs (right) of H22 cells after serum starvation, showing intact cells and apoptotic body and blebs. The fractions were separated and labeled with DiD before incubation with DCs. (b) Western blot analysis of CENPF expression in healthy H22 cells (lane 1), intact cells (lane 2), apoptotic body and blebs (lane 3). (c) Flow cytometric analysis of the proportion of CD11c+ DCs that had ingested/bound DiD-labeled apoptotic cell components. Binding (4°C) and uptake/binding (37°C) were quantified as the percentage of FITC/DiD double-positive cells. (d) Fluorescence microscopy of CD11c+ DCs (green) incubated alone or with DiD-labeled intact cells or apoptotic body and blebs (red). The nucleus was revealed with DAPI (blue). Scale bar 10 μm. (e) Proportion of mature DCs (CD86+) after incubation with intact cells, apoptotic body and blebs, or LPS (positive control). Proportion of phagocytotic (f) or mature (g) DCs after incubation with intact cells or apoptotic body and blebs from H22 WT or KD cells respectively. **, p < .01
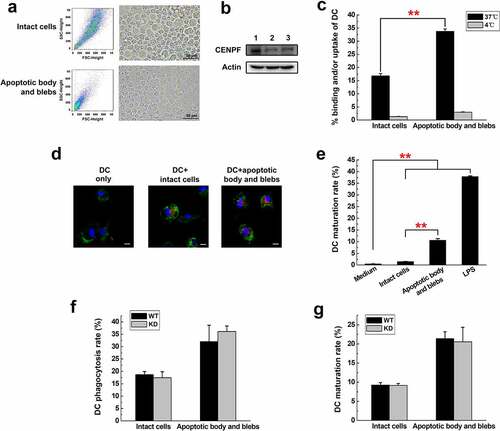
Figure 7. HCC apoptotic cell components induce anti-CENPF antibody production in BALB/c mice. Groups of mice were injected with saline, H22 apoptotic intact cells, H22 apoptotic body and blebs, or H22 cell lysate once a week for 7 weeks. (a) Serum CENPF antibody levels measured by Elisa every week. (b) Images and weights of mouse spleens at week 7. (c) Immunofluorescence staining of the B cell marker B220-Alexa Fluor 488 (left) and H&E staining (right) of sections of spleens obtained from mice injected with saline (a, b), cell lysate (c, d), intact cells (e, f), and apoptotic body and blebs (g, h). Scale bar 150 μm. *, p < .05. **, p < .01
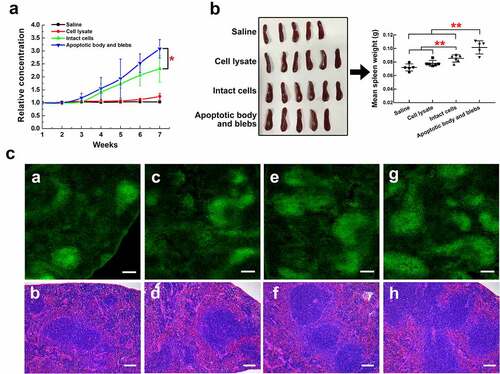
Figure 8. Anti-CENPF antibody production induced by HCC apoptotic cell components with or without CENPF knockdown in BALB/c mice. Groups of mice were injected with saline, apoptotic intact cells or apoptotic body and blebs from H22 WT or KD cells once a week for 6 weeks. (a) Serum CENPF antibody levels measured by Elisa every week. (b) Images and weights of mouse spleens at week 6. (c) H&E staining of sections of spleens obtained from mice injected with saline (a), intact cellsWT (b), apoptotic body and blebsWT (c), intact cellsKD (d), and apoptotic body and blebsKD (e). Scale bar 150 μm. **, p < .01
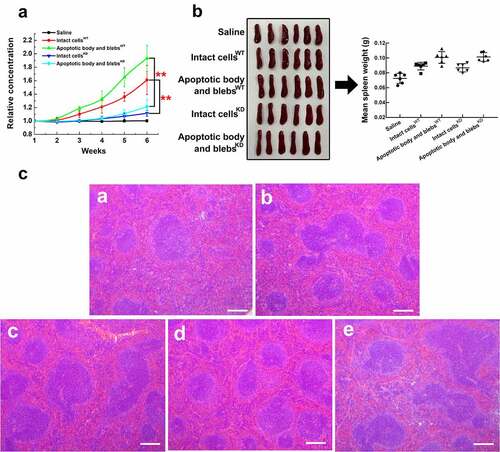
Figure 9. Expression of CD31 and CD47 in H22 WT and KD cells, or different apoptotic cell components. The CD31 (a) or CD47 (b) positive rate in H22 WT and KD cells was analyzed by flow cytometry. The CD31 (c) or CD47 (d) positive rate in healthy H22 cells, intact cells, apoptotic body and blebs was analyzed. **, p < .01
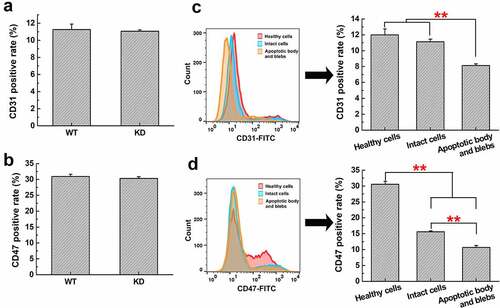
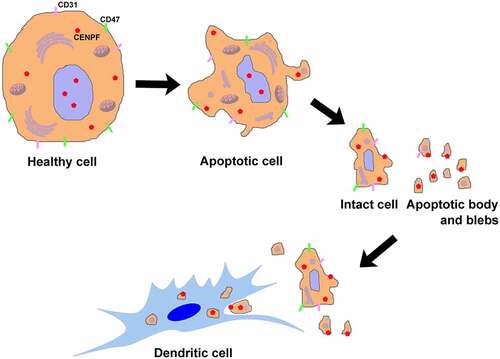
Figure 10. Apoptosis plays a role in CENPF autoantigen translocation, exposure, and antigen-presentation of DCs mainly through apoptotic body and blebs