Figures & data
Figure 1. Metformin promotes NK cell-mediated lysis activity. NK-92 cell cytotoxicity toward cancer cell lines was measured using an LDH release assay (a). NK92 cells were treated with 100 µM metformin for 24 h, 48 h or 72 h, and then cytotoxicity toward K562 cells was measured using an LDH release assay (b). NK-92 cells were treated with two different concentrations of metformin for 24 h and then incubated with K562 cells for 4 h at 37°C. The expression of CFSE/PI (c, d) and CD56+ CD107a+ were then observed with flow cytometry (e, f). Perforin, granzyme B and IFN-γ expressions in NK-92 cells treated with metformin were determined using ELISA (g-i). NK-92 cells were treated with different concentrations of metformin for 24 h, and the expression of NKG2D, NKp30 and NKp44 was then observed using western blots (j). Data represent the mean ± SEM (n = 6). Data shown represent at least three independent experiments. *p < .05, **p < .01, ***p < .001 by two-tailed Student’s t-test (a, b, g, h, i), one-way ANOVA with the Dunnett’s test (d, f)
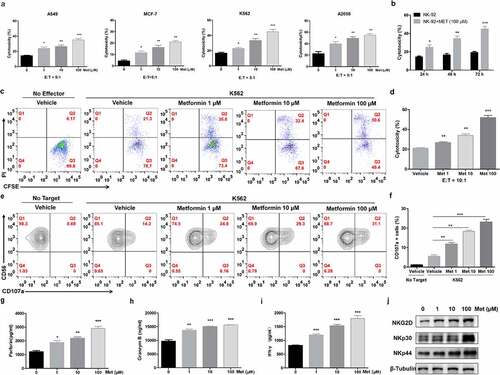
Figure 2. Metformin enhances the cytolytic activity of primary NK cells from healthy donors. PBMCs from healthy donors were activated and pretreated with metformin for 20 h, then mixed with K562 cells. After 4 h of incubation at 37°C, the expression of CFSE/PI (a), CD3−CD56+CD16+/CD107a (b), CD4+ and CD8+ T cells (c) and CD8+/CD107a (d) in PBMCs from healthy donors were then observed with flow cytometry. Data represent the mean ± SEM (n = 6). Data shown represent at least three independent experiments. *p < .05, **p < .01, ***p < .001 by one-way ANOVA with the Dunnett’s test
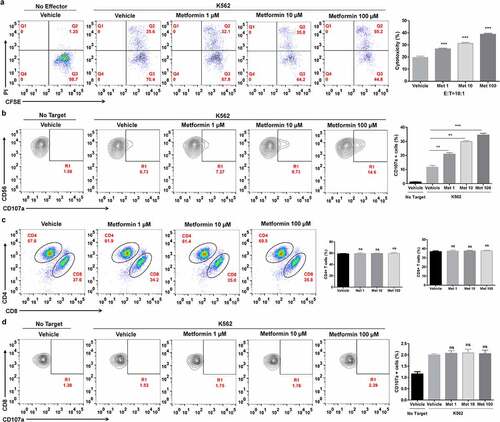
Figure 3. Metformin enhances the cytolytic activity of ascites NK cells from cancer patients. Cells from the ascites of lung cancer patients were activated and pretreated with metformin for 20 h, then mixed with K562 cells. After 4 h of incubation at 37°C, the expression of CFSE/PI (a), CD3−CD56+CD16+ /CD107a (b), CD4+ and CD8+ T cells (c) and CD3+CD8+/CD107a (d) in the ascites of lung cancer patients were then observed with flow cytometry. Data represent the mean ± SEM (n = 6). Data shown represent at least three independent experiments. *p < .05, **p < .01, ***p < .001 by one-way ANOVA with the Dunnett’s test
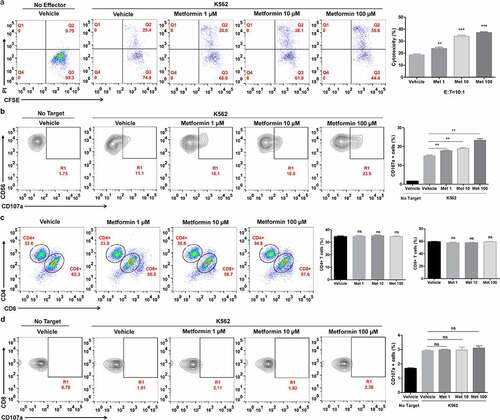
Figure 4. Metformin activates NK cells through the p38 MAPK-dependent pathway. The expression levels of the total and phosphorylated JAK1/2/3 (a, b), STAT1/3/5 (c, d) and mTOR/AKT (e, f) in metformin-treated cells were compared with those in untreated metformin-treated cells by western blotting. The amounts of NKG2D, phosphorylated p38 MAPK, and AMPK in metformin-treated cells were compared with those in untreated metformin-treated cells (g, h). NK-92 cells were pretreated with MAPK inhibitor Doramapimod (i, j, k), treated with metformin, and then analyzed by western blot. NK-92 cells were pretreated with si- p38 MAPK, and then treated with metformin. The expression levels of phosphorylated p38 MAPK, JAK1 and STAT5 were analyzed by western blot (l, m, n). Data represent the mean ± SEM (n = 6). Data shown represent at least three independent experiments. *p < .05, **p < .01, ***p < .001. The data were analyzed using the two-tailed Student’s t-test
Figure 5. Metformin enhances NK cell-mediated lymphoma clearance in vivo. CFSE-stained RMA (low CFSE concentration) and RMA-s cells (high CFSE concentration) were mixed at a ratio of 1:1 and then injected i.p. into C57BL/6 mice, and the rejection of RMAs relative to the peritoneal cavity was measured using flow cytometry (a). C57BL/6 mice were treated with i.p. injection of anti-asialo-GM1 (50 µL) or control serum for three consecutive days before an i.p. injection of cells. After 12 h post challenge of RMA:RMA-s cells, mice were sacrificed and the frequencies of NK cells (CD3−NKp46+) in the spleen of each group are shown as representative flow cytometry profile (b) and summary graph of statistical bar charts (c). C57BL/6 mice received either metformin (100 mg/kg; i.p.) or vehicle with or without anti-asialo-GM1 (50 µL) for 3 consecutive days before cell injection. Representative result (d) and a summary graph of statistical bar charts (e) showing the percentage of rejected RMA-s cells. C57BL/6 mice received increasing doses of metformin (i.p.) for 3 consecutive days before cells injection. Representative result (f) and summary graph of statistical bar charts (g) showing the percentage of rejected RMA-s cells. Data represent the mean ± SEM of 4 mice per group. Data shown represent at least three independent experiments. *p < .05, **p < .01, ***p < .001. The data were analyzed using by two-tailed Student’s t-test (c, e), one-way ANOVA with the Dunnett’s test (g)
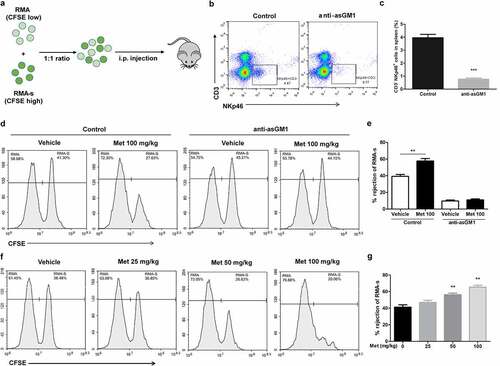
Figure 6. Metformin enhances NK cell-mediated protection against pulmonary metastatic melanoma in vivo. (a) C57BL/6 mice received an i.v. injection of 2 × 10⁵ B16F10 cells and then received either metformin or vehicle daily. After 14 days of tumor implantation, the mice were euthanized, and the number of metastatic tumor colonies in the lungs was counted after fixation. Representative lung image (b) and a summary graph of statistical bar charts (c) showing pulmonary metastases of B16F10 cells. The frequencies of CD3−NK1.1+ cell (d, f) and the frequencies of CD3−NKp46+ cells (e, g) in the spleen of each group are shown as representative flow cytometry. Thereafter, mouse primary NK cells were incubated with YAC-1 target cells for 4 h (h). Data represent the mean ± SEM of 6 mice per group. Data shown represent at least three independent experiments. *p < .05, **p < .01, ***p < .001 by one-way ANOVA with the Dunnett’s test
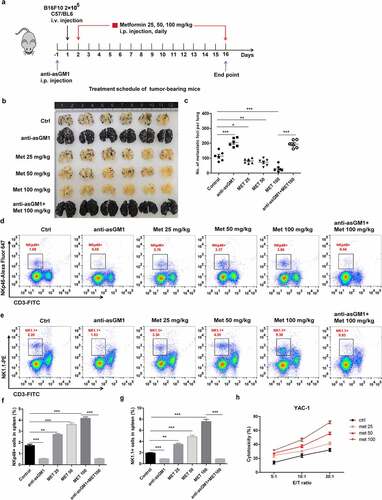
Figure 7. The combination of metformin with anti-PD-1 enhances the therapeutic efficacy against established B16F10 melanoma tumors. The experimental scheme of metformin therapy combined with PD-1 blockade (a). Measurement of tumor volume (b, d) and weight in each group (c, e). The frequencies of CD3−NK1.1+ cells (f), the frequencies of CD3−NKp46+ cells (g) and the frequencies of CD3+CD8+ cells (h) in the spleen of each group are shown as representative flow cytometry. Data represent the mean ± SEM of 6 mice per group. Each symbol represents an individual mouse. Data shown represent at least three independent experiments. *p < .05, **p < .01, ***p < .001. The data were analyzed using the Two-way ANOVA (b and d) or two-tailed Student’s t-test (the rest)
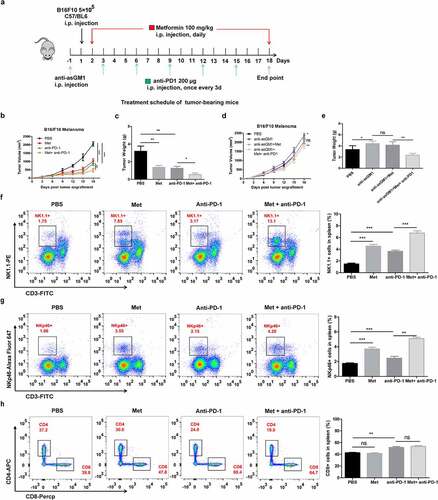
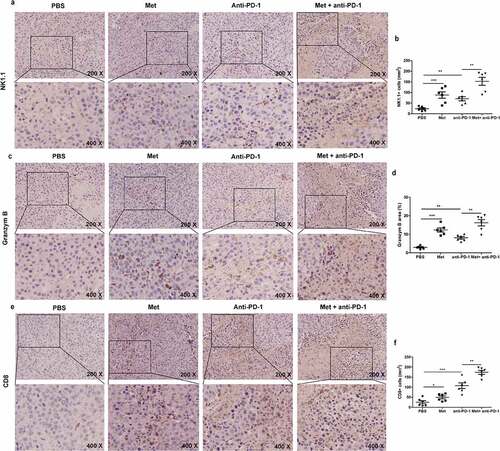
Figure 8. The combination of metformin with anti-PD-1 promotes NK cells and T cells recruitment to the tumor microenvironment. The summarized data and representative results of NK1.1 (a) (b), Granzyme B (c) (d) and CD8 (e) (f) staining of tumors by IHC. All images were obtained at ×200 and ×400 magnification. Data represent the mean ± SEM of 6 mice per group. Data shown represent at least three independent experiments. *p < .05, **p < .01, ***p < .001. The data were analyzed using the two-tailed Student’s t-test