
Figures & data
Figure 1. CS1 expression in MM patient samples and the 5TMM model. (a) CS1 expression was investigated using microarray data of the Heidelberg–Montpellier (HM) cohort. Expression was analyzed in bone marrow stromal cells (BMSC; n = 5), CD14+ (n = 5), CD15+ (n = 5), CD3+ (n = 5), CD34+ (n = 5), naive B-cells (n = 5), CD138+ cells of patients with monoclonal gammopathy of undetermined significance (MGUS; n = 5) and primary MM cells of newly diagnosed patients (n = 206). (b) Using the TT2 cohort, CS1 expression was evaluated in bone marrow plasma cells (BMPC) from healthy donors (n = 22) and at various stages of MM disease including MGUS (n = 44), smoldering MM (SMM) (n = 12) and MM (n = 345). (c) CS1 expression in MM cells derived from newly diagnosed patients (n = 40) and at relapse (n = 39) (MMRF cohort). (d) CS1 expression in NK (idiotype−, NK1.1+), myeloid (idiotype−, CD11b+), T (idiotype−, CD3+) and MM cells (idiotype+) derived from the bone marrow and spleen of the 5T33MM mouse model (n = 3, mean±SD, *p < .05, Mann-Whitney U test). (e) Representative flow cytometry result of CS1 expression in 5T33MM cells derived from spleen and bone marrow. (f) CS1 expression in proliferating and dormant MM cells using the in vivo 5TGM1 myeloma dormancy model. Dormant (5TGM1-GFP+, DiD+) cells and proliferating (5TGM1-GFP+, DiD−) myeloma cells were analyzed for CS1 expression by flow cytometry (n = 3, one representative result is shown)
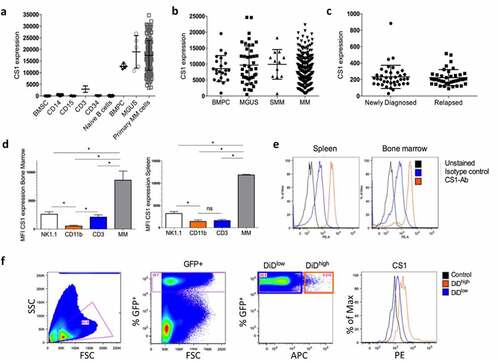
Figure 2. In vitro characterization of murine CS1-specific sdAbs. (a) Summary of ELISA, flow cytometry (on 5T33MMvv cells) and SPR of 10 selected, His6-tagged mCS1 targeting sdAbs. (b) Flow cytometry result of His6-tagged CS1 sdAb1 binding on 5T33vv cells (R3B23 is used as a control sdAb) (one representative result). (c) SPR sensorgram of untagged sdAb1. (d) Thermal stability of His6-tagged, untagged and DTPA-conjugated sdAb1. (e) Amino acid sequence of 10 selected CS1 sdAbs
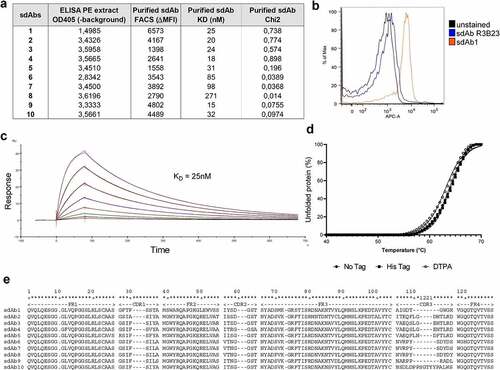
Figure 3. Biodistribution of CS1-specific sdAbs in naive, 5TGM1 and 5T33MM mice. (a) µSPECT/CT h.p.i. of 99mTc-labeled sdAb1 in naive mice, 5TGM1 (moderate model) and 5T33 (aggressive model) MM mice. One representative picture (n = 3/sdAb/model). White arrows indicate bone uptake. (b-e) Organs were dissected and radioactivity was measured in bone, spine, spleen and liver (n = 3/sdAb). Data is presented as mean±SD percentage injected activity per gram organ or tissue (%IA/g).*p < .05, Mann-Whitney U test
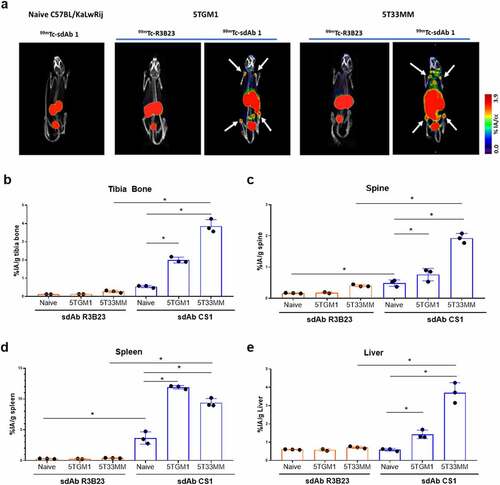
Figure 4. Anti-CS1 TRNT, in a stage of low tumor burden, significantly impacts the survival of 5T33MM mice. (a) Treatment schedule of 5T33MM mice with [225Ac]-sdAb1. Mice (n = 13/group) were treated with either saline buffer, [225Ac]-R3B23 sdAb (control sdAb) or [225Ac]-sdAb1 at day 4, 7, 10 and 13. At end-stage of disease, mice were sacrificed. (b) Body weight after α-TRNT with [225Ac]-sdAb1 in the 5T33MM model. (c) Survival curves after α-TRNT with [225Ac]-sdAb1 in the 5T33MM model. p values were determined using the log-rank test and found to be highly significant, ****p < .0001
![Figure 4. Anti-CS1 TRNT, in a stage of low tumor burden, significantly impacts the survival of 5T33MM mice. (a) Treatment schedule of 5T33MM mice with [225Ac]-sdAb1. Mice (n = 13/group) were treated with either saline buffer, [225Ac]-R3B23 sdAb (control sdAb) or [225Ac]-sdAb1 at day 4, 7, 10 and 13. At end-stage of disease, mice were sacrificed. (b) Body weight after α-TRNT with [225Ac]-sdAb1 in the 5T33MM model. (c) Survival curves after α-TRNT with [225Ac]-sdAb1 in the 5T33MM model. p values were determined using the log-rank test and found to be highly significant, ****p < .0001](/cms/asset/6d7b3950-8ddb-42c4-8334-4900f3162d07/koni_a_2000699_f0004_oc.jpg)
Figure 5. Anti-CS1 TRNT increased CD8+ T–cells and PD-L1 expression in the bone marrow of 5T33MM mice. 5T33MM mice (n = 3/group) were treated with either [225Ac]-R3B23 sdAb (control sdAb) or [225Ac]-sdAb1 at day 4, 7, 10 and 13. At day 18, mice were sacrificed and bone marrow cells were analyzed by flow cytometry. (a) % eF506−, CD45+ cells, (b) % PD-L1+ cells in CD45− cells, (c) % PD-L1+ cells in CD45+ cells, (d) % CD8+ cells in CD45+ cells, (e) % CD4+ cells in CD45+ cells, (f) % CD11b+, CD11 c−, Ly6G−, F4/80+ cells in CD45+ cells. Data is presented as mean±SD.*p < .05, Mann-Whitney U test
![Figure 5. Anti-CS1 TRNT increased CD8+ T–cells and PD-L1 expression in the bone marrow of 5T33MM mice. 5T33MM mice (n = 3/group) were treated with either [225Ac]-R3B23 sdAb (control sdAb) or [225Ac]-sdAb1 at day 4, 7, 10 and 13. At day 18, mice were sacrificed and bone marrow cells were analyzed by flow cytometry. (a) % eF506−, CD45+ cells, (b) % PD-L1+ cells in CD45− cells, (c) % PD-L1+ cells in CD45+ cells, (d) % CD8+ cells in CD45+ cells, (e) % CD4+ cells in CD45+ cells, (f) % CD11b+, CD11 c−, Ly6G−, F4/80+ cells in CD45+ cells. Data is presented as mean±SD.*p < .05, Mann-Whitney U test](/cms/asset/a3cdfa01-fc94-431b-87e3-77fe42545fa1/koni_a_2000699_f0005_oc.jpg)