Figures & data
Figure 1. STAT3 promotes experimentally induced lymphomagenesis and germinal center B-cell proliferation and is activated in IL-10RA-expressing ABC-DLBCL patients. a-c, Disease-specific mortality and lymphoma burden of cohorts of 8–25 mice each of the indicated genotypes (n is indicated in the figure). Mice were immunized every two weeks i.v. with sheep red blood cells to induce AID-Cre expression. Pooled weights of the axillary and inguinal lymph nodes are shown in b, and spleen weights are shown in c for all mice of the study. d-f, Mice of the indicated genotypes were immunized once i.v. with sheep red blood cells and assessed 10 days later for their lymph node weights (combined axillary and inguinal; d) and by flow cytometry of splenocytes for their frequencies of GC B-cells (e) and centroblasts (f). g,h, 122 DLBCL cases were stained for IL-10RA and pSTAT3; G reports the number of pSTAT3+ cells per mm2 of all 102 IL-10RA+ and 20 IL-10RA− cases. Representative stainings of IL-10RA and pSTAT3 are shown in h; scale bar, 100 µm. Ii, Correlation of STAT3 with IL10 and IL10RA expression, respectively, plotted for 206 DLBCL patients for whom RNA-seq-based transcriptomic data is available via TCGA. The color codes and symbols indicate genetic subtype as assigned by Schmitz et al.Citation4 Data in a-c are pooled from four cohorts of littermates; data in d-f are pooled from three independent studies. Horizontal lines indicate medians throughout. Statistical comparisons were performed either by one-way ANOVA (in the case of normal data distribution) or by non-parametric ANOVA (Kruskal–Wallis test, in the case of non-normal data distribution) with Tukey’s multiple comparisons correction, or by log rank test (in i). n is indicated in each figure panel. ns, not significant, *p < .05, **p < .01, ***p < .005, ****p < .0001
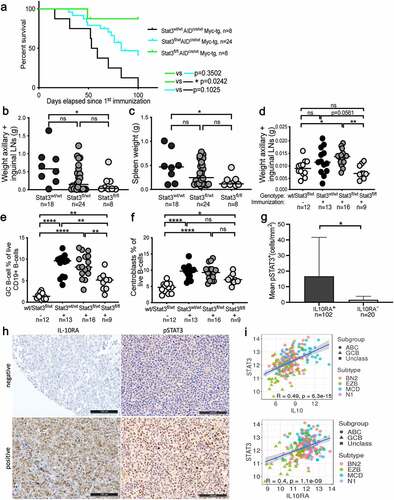
Figure 2. IL-10 expression is highest in ABC-DLBCL with co-occurring MYD88/BCR mutations and can be blocked by BTK inhibition. a-c, IL-10RA expression was assessed by flow cytometry (a,b) and at the transcript level by qRT–PCR (c), normalized to RPLP32, for a panel of 13 DLBCL cell lines. ABC- and GCB-DLBCL cell lines are color-coded in red and green; RC-K8 is depicted in gray, as it shares features with both subtypes; bold labeling indicates the IL-10RA-positive cell lines in a. b shows the means + SD of at least two and up to three independent measurements, except for HBL-1 and OCI-Ly10, which were analyzed only once. d,e, IL-10 production of the indicated cell lines (color code as in a-c) as quantified by ELISA and normalized to cell number (shown per 1,000 cells, d), and by qRT–PCR, normalized to RPLP32 (e). n.d., not detectable. The mutational status of the indicated genes is shown below the bar graphs in d; + indicates that the gene is mutated; ? indicates that the SOCS1 status of the SU-DHL8 cell line is a matter of debate. f, IL-10 production of the indicated cell lines, as assessed by ELISA after 48 hours of incubation with or without 0.01 µM ibrutinib. Pooled data from two to three sets of samples/experiments are shown in c-f. g, IL10 and IL10RA gene expression of 206 DLBCL cases, stratified based on genetic subtype as assigned by Schmitz et al.Citation4 h, Co-oncoplots showing the mutational landscape of IL10hi and IL10low (left panels), as well as IL10RAhi and IL10RAlow (right panels) DLBCL cases (highest and lowest quartile, respectively, representing ~50 cases each, cases sorted by decreasing expression of the gene of interest). Nine genes with most variants between the lowest and highest quartiles are shown; color codes indicate genetic and gene expression subtypes and type of mutation. Note that a missense mutation is a non-synonymous mutation that changes a codon, and a nonstop mutation is a type of missense mutation but occurs specifically within the stop codon. p-values (*p < .05, **p < .01, ***p < .005, determined by log-rank test) next to gene symbols indicate that that gene is significantly differentially affected by mutations in the lowest vs. highest quartile of IL10/IL10RA expression. See also Supplementary Fig. S2 for comprehensive oncoplots of all 206 patients
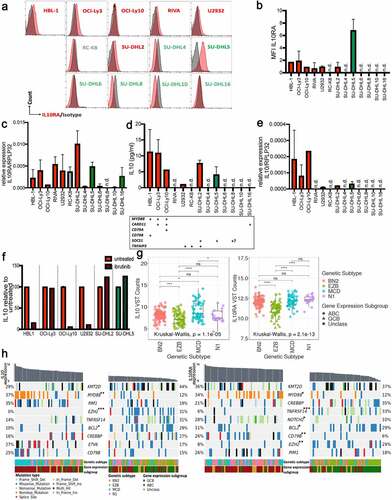
Figure 3. IL-10 induces STAT3 phosphorylation in IL-10RA-positive DLBCL cell lines. a,b, STAT3 phosphorylation as determined by Western blotting of the indicated ABC-DLBCL and GCB-DLBCL cell lines, with and without 2 hours of exposure to 30 ng/mL hIL-10. A representative Western blot is shown in a, and the densitometric quantification of pSTAT3/STAT3, normalized to tubulin, of one to three Western blots per cell line is shown as means + SD in b. c, STAT3 phosphorylation as assessed by Western blotting and quantified by densitometry, of two representative ABC-DLBCL cell lines, with or without 2 hours of exposure to 10 µg/mL IL-10RA-neutralizing antibody (clone 37607). d,e, Genetic deletion of IL10RA by CRISPR/Cas9 in the two indicated ABC-DLBCL cell lines results in loss of IL-10RA expression as determined by flow cytometry (d) and in reduced STAT3 phosphorylation as assessed by Western blotting (e) (WT, wild type; KO, IL-10RAKO). Data are representative of two clones per cell line, generated with two different single guide RNAs
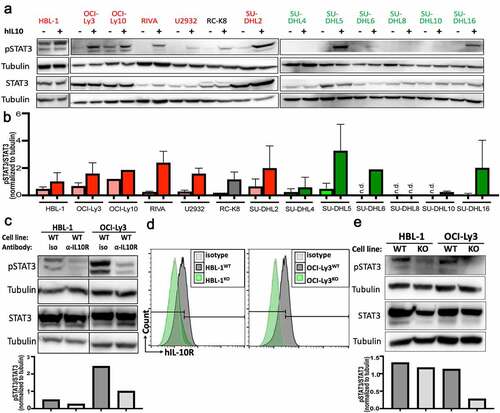
Figure 4. The IL-10 signaling axis is essential for lymphoma growth in vivo in xenotransplantation models. a-c, NSG and MISTRG6 mice were subcutaneously injected with 1 × 10⁷ IL-10RA-proficient and -deficient OCI-Ly3 (a) or HBL-1 cells (b) on each flank at 6–8 weeks of age; tumor weights were determined at the study end point (5–6 weeks for NSG and 3 weeks for MISTRG6 mice). Data are pooled from two to four independent studies per graph, except for OCI-Ly3 in MISTRG6, which was done only once. The image in c shows tumors from MISTRG6 mice. d,e, MISTRG6 mice were intravenously injected with 1 × 10⁷ IL-10RA-proficient or -deficient HBL-1 cells at 6 weeks of age; the lymphoma burden was quantified in the spleen (SP, d) and bone marrow (BM, e) by flow cytometric staining for hCD45 and by ZsGreen expression at the study endpoint (5 weeks post injection). Data in d and e are pooled from three independent experiments. Horizontal lines indicate medians. *p < .05, ***p < .005, ****p < .001, as determined by Mann-Whitney test
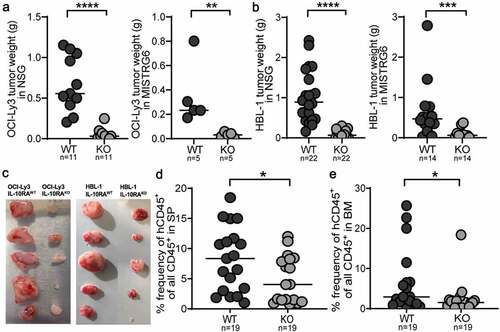
Figure 5. Neutralization of IL-10R signaling reduces the lymphoma burden in a syngeneic transplantation model and reduces the intratumoral frequencies of regulatory T-cells. a-e, C57BL/6 mice were intravenously injected with 1 Mio >90% pure lymphoma cells isolated from the spleens of Eµ-Myc-transgenic donors, and examined at the study endpoint (10–15 days post injection) with respect to their lymph node weights and the frequencies and surface marker expression of various lymph node leukocyte populations by flow cytometry. An initial dose of 500 µg anti-IL-10RA neutralizing or control IgG antibody was i.p. injected shortly before tumor cell inoculation, followed by twice weekly injections of 300 µg antibody. Control mice did not receive tumor cells. (a) Combined axillary and inguinal lymph node weights of anti-IL-10RA- or control IgG antibody-treated mice. (b) Tumor B-cell frequencies in axillary and inguinal lymph node preparations as determined by staining for CD19 and CD45, of the mice shown in A, alongside representative FACS plots of one mouse per group. The Ki67 signal of the tumor B-cells is shown as well. See suppl. Figure 5a for the complete gating strategy. (c,d) Frequencies of TCRβ+ T-cells, of CD4+ T-cells and of CD8+ T-cells among all leukocytes, as determined by flow cytometry. See suppl. Figure 5c for the gating strategy. (e) Frequencies of FoxP3+ Tregs among all CD4+ T-cells, as determined by intracellular staining for FoxP3; representative FACS plots of one mouse per group are shown alongside the summary plot for all mice. f,g, Frequencies of tumor B-cells and of CD4+ T-cells in axillary and inguinal lymph node preparations as determined by staining for CD19, CD4 and CD45, of anti-IL-10R- or control IgG antibody-treated WT and Foxp3-iDTR mice. Mice received twice weekly i.p. doses of 20 ng/g diphtheria toxin (DT) to deplete Tregs, starting from one day before tumor cell injection. Treg depletion efficiency was >90%. Four mice were each injected i.v. with 100ʹ000 Tregs that had been sorted from the tumors of Foxp3-iDTR mice based on their GFP expression, on day four post tumor cell transplantation. h, MHCII expression as determined by flow cytometry, of a subset of the mice shown in a-e. A representative histogram of the MHCII signal of two representative mice is shown alongside the summary plot of all mice. i-k, C57BL/6 mice were intravenously injected with 1 Mio >90% pure lymphoma cells and examined at the study endpoint (10–15 days post injection) with respect to their lymph node weights (i), tumor B-cell frequencies (j) and CD4+/CD8+ T-cell frequencies (k). An initial dose of 500 µg anti-IL-10RA neutralizing and/or MHCII-blocking or control IgG antibody was i.p. injected shortly before tumor cell inoculation, followed by twice weekly injections of 300 µg antibody. Control mice did not receive tumor cells. Data in a-e are pooled from four independent experiments; data in f,g are pooled from one to six experiments, Treg transfer was only performed once. Data in hare from three experiments and data in i-k are from two experiments; note that several mice were lost to follow-up by flow cytometry. Horizontal lines indicate medians. Statistical comparisons were performed either by one-way ANOVA (in the case of normal data distribution) or by non-parametric ANOVA (Kruskal–Wallis test, in the case of non-normal data distribution) with Tukey’s multiple comparisons correction. ns, not significant, *p < .05, **p < .01 ***p < .005, ****p < .001
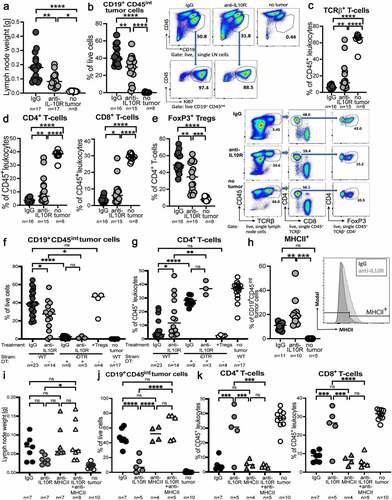
Figure 6. Genetic ablation of Treg-intrinsic IL-10 signaling reduces lymphoma growth. a-e, Foxp3-Cre x Il10rfl/fl mice and their Foxp3-Cre x Il10rwt/wt littermates were intravenously injected with 1 Mio >90% pure lymphoma cells isolated from the spleens of Eµ-Myc-transgenic donors, and examined at the study endpoint (10–15 days post injection) with respect to their lymph node and spleen weights (a) and tumor B-cell frequencies (b); control mice did not receive tumor cells. A subset of mice was subjected to multi-dimensional flow cytometry using a panel of 24 intracellular and surface markers that allowed the identification and quantification of the six indicated conventional and regulatory T-cell populations. A UMAP showing the FlowSOM-guided manual metaclustering of the six indicated CD4+ T-cell subsets is shown for four mice per group, and for all three experimental groups in c, along with the quantification of the six T-cell populations in d. The heatmap in E shows the median marker expression (value range: 0–1) of Tregs in each experimental group. Data in a and b are pooled from three studies; data in c-e are from one study. f-h, C57BL/6 mice were intravenously injected with 1 Mio lymphoma cells, and examined at the study endpoint (10–15 days post injection) with respect to their lymph node weights (f) and intratumoral Treg frequencies (g). Mice were treated orally with twice weekly doses of ibrutinib (25 mg/kg body weight) from day 4 post tumor cell injection onwards. IL-10 expression was analyzed by qRT-PCR of sorted tumor or normal B-cells, and normalized to GAPDH. Two pooled studies are shown in f and g; data in h are from one study. Statistical comparisons were performed either by one-way ANOVA (in the case of normal data distribution) or by non-parametric ANOVA (Kruskal–Wallis test, in the case of non-normal data distribution) with Tukey’s multiple comparisons correction. ns, not significant, *p < .05, **p < .01 ***p < .005, ****p < .001
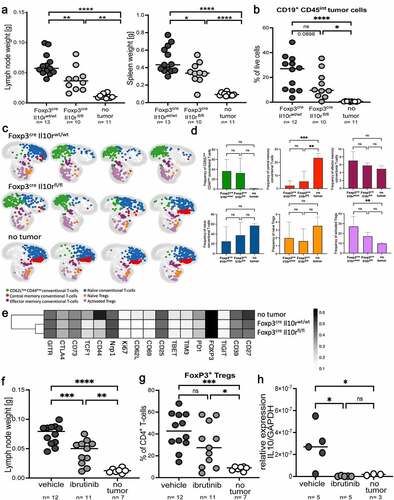
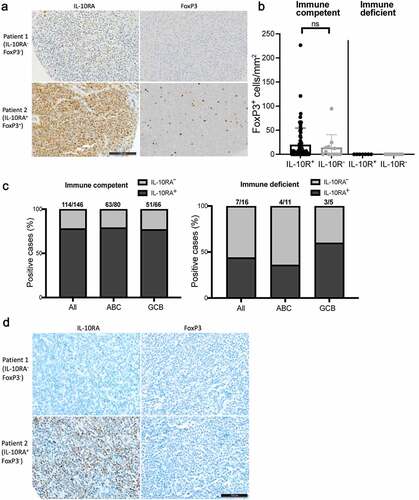
Figure 7. IL-10RA expression and Treg infiltration are more pronounced in DLBCL from immunocompetent relative to immunosuppressed patients. a,b, IL-10RA and FoxP3 expression, as determined by immunohistochemistry of 146 immunocompetent and 16 immunosuppressed DLBCL patients. Representative pairs of stainings are shown in a for two immunocompetent cases, of whom one was IL-10RA−FoxP3− and one was IL-10RA+FoxP3+ (scale bar, 100 µm). FoxP3+ cells/mmCitation2 are shown in b for all patients; each symbol represents one patient. c, Fraction (in %) of IL-10RA-positive among all cases in an immunocompetent (left panel) and an immunosuppressed (right panel) DLBCL patient cohort, as determined by immunohistochemistry. Positivity was further stratified by gene expression subtype (ABC, GCB) that was assigned based on the Hans classification. d, Representative pairs of stainings for IL-10RA and FoxP3, performed on two immunosuppressed cases, of whom one was IL-10RA−FoxP3− and one was IL-10RA+FoxP3− (scale bar, 100 µm)