Figures & data
Table 1. Patient and tumor characteristics
Figure 1. IHC scores for BDNF expression in tumor tissues from 249 GIST patient
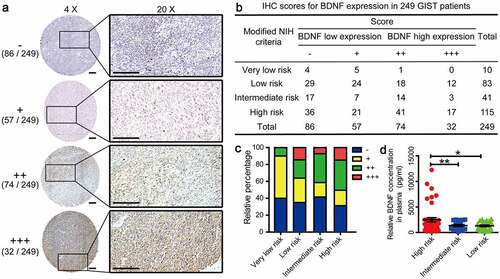
Table 2. Correlations between BDNF expression and clinicopathologic features in GIST patients
Table 3. Univariate analyses of prognostic parameters for survival in patients with gastrointestinal stromal tumor (GIST)
Figure 2. Prognostic value of BDNF in GIST patients
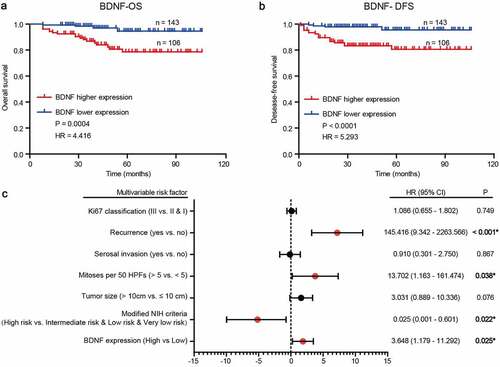
Figure 3. The sensitivity and specificity of BDNF for GIST prognosis
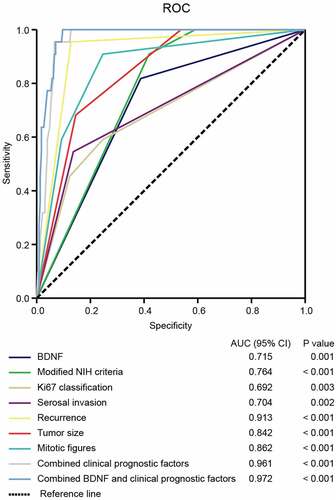
Figure 4. The relationship between BDNF expression and immune checkpoint proteins
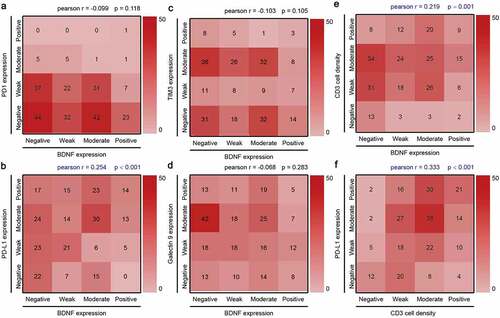
Table 4. Correlations between PD-L1+ TIL density and clinicopathologic features in GIST patients
Figure 5. Prognostic value of PD-L1+ TIL in GIST patients
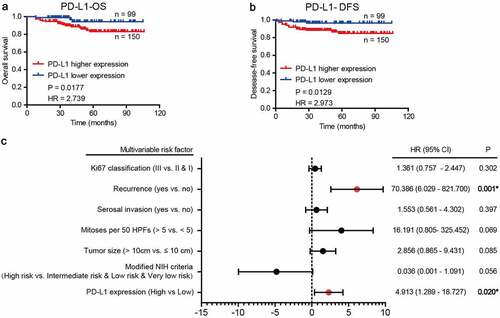
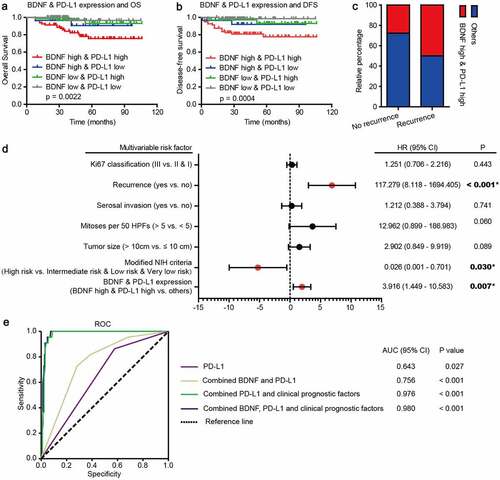
Figure 6. Relationship of BDNF expression and PD-L1+ expression on TILs with patient survival