Figures & data
Figure 1. Deep learning screening identified a novel compound that inhibits IDO and TDO. IDO and TDO dual inhibitor, STB-C017 (STB), was identified through a deep learning model and validated both in vitro and in vivo. (a) Diagram depicting the identification and optimization of the lead compound, STB, through deep learning model. (b) Measurement of IDO and TOD enzyme kinetics using an enzyme-based assay. (c) Measurement of IDO and TDO cellular activity using a cell-based assay. (d) Mice were treated with vehicle or STB 24 h after a single intraperitoneal injection of LPS (0.8 mg/kg). Comparison of plasma kynurenine (Kyn) levels. (e) Comparison of mRNA expression levels of IDO and TDO, and comparison of Kyn levels in CT26 and CT26-TDO cell lines. (f) Comparison of Kyn levels in CT26 cell line in vitro and CT26 tumor growth in vivo treated with EPA or STB. (g) Comparison of Kyn levels in CT26-TDO cell line in vitro and CT26-TDO tumor growth in vivo treated with EPA or STB. Values are presented as the mean ± SD. *p < .05 versus control; #p < .05 versus LPS. One-way ANOVA (d) and two-tailed Student’s t-test (e-g) were used. IDO, Indoleamine 2,3-dioxygenase; TDO, Trp 2,3-dioxygenase; STB, STB-C017; LPS, Lipopolysaccharide
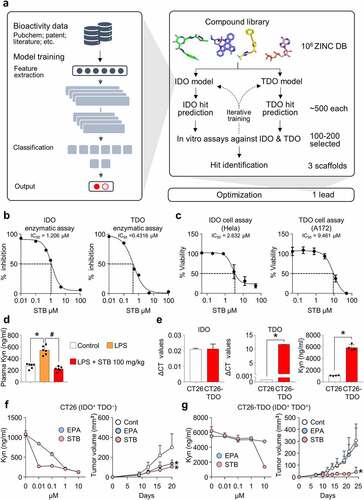
Figure 2. Dose and schedule optimization of STB treatment. CT26 tumor cells were subcutaneously implanted into mice, which were treated orally with vehicle or STB. (a) Diagram of the treatment schedule. Arrows indicate treatment. (b) Comparison of CT26 tumor growth in mice treated with vehicle or STB using different doses. (c) Comparison of body weight in mice treated with vehicle or STB. (d) Diagram of the treatment schedule. Black arrows indicate vehicle and red arrows indicate STB treatment. (e) Comparison of tumor growth in mice treated with vehicle or STB using different treatment schedules. (f) Comparison of CT26 mouse weight upon treatment with vehicle or STB. Values are presented as the mean ±SD. *p < .05 versus control. A two-tailed Student’s t-test (b, e) was used
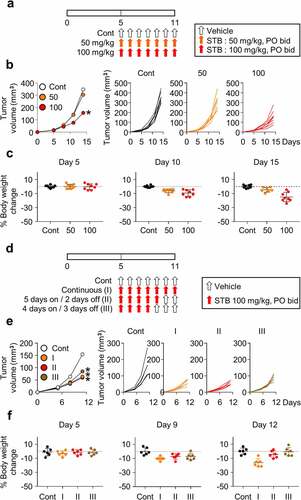
Figure 3. STB suppresses Kyn accumulation and infiltrates CD8+ T cells within tumor microenvironment. Mice were subcutaneously implanted with CT26 tumor cells and orally treated with vehicle or STB. (a) Comparison of intratumoral tryptophan (Trp) and Kyn level. (b-e) Representative images and comparisons of Kyn expression, CD8+ T cell numbers (b), GzB+ T cell activation (c), cell proliferation (d) and cell apoptosis (e) within tumors. (f) Representative flow cytometry plot and comparisons of CD8+ T cell, CD4+ T cell and CD8+ICOS+ cell fractions. (g) Comparisons of CD4+Foxp3+CD25+ Treg fraction and CD8/Treg ratio in tumors. (h) Comparisons of CD11b+F4/80+ TAMs and CD11b+Ly6G+ MDSCs fractions in tumors. (i) Representative flow cytometry plot showing the level of multiple cytokines in the plasma. Values are presented as the mean ±SD. *p < .05 versus control. A two-tailed Student’s t-test (a -i) was used. Scale bars, 50 μm. GzB, granzyme B; Treg, regulatory T cell; TAM, tumor-associated macrophage; MDSC, myeloid-derived suppressor cell
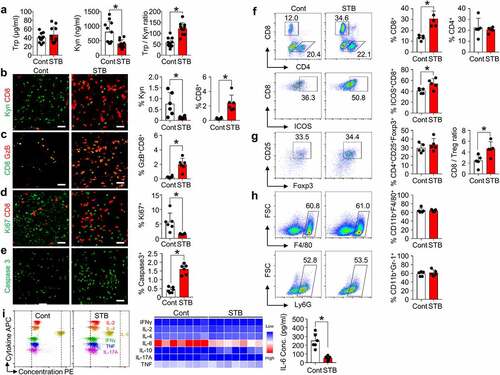
Figure 4. STB induced widespread transcriptional programs that activate T cell immunity. CT26 tumor cells were implanted subcutaneously into mice, which were treated orally with vehicle or STB and the depleting antibody for CD8 (αCD8). (a) Dot plot showing enrichment of GO biological processes for NanoString immune-related genes in mice treated with vehicle or STB. 17 GO biological processes with the largest gene ratios are plotted in order of gene ratio. The size of each dot represents the number of genes significantly related to immunity associated with the GO term and the color of the dots represent the P-adjusted value. (b) GESA of gene sets involved in T cell and immune response activation. (c) Comparisons of gene expression related to the Kyn pathway and TME, Th1 response, Th2 response, endothelial cell (EC)-lymphocyte (LC) interaction, agonistic immune checkpoints, and inhibitory immune checkpoints. (d) Diagram of the treatment schedule. Arrows indicate treatment. (e) Comparison of CT26 tumor growth in mice. Mean and individual tumor growth curves over time. (f) Representative flow cytometry plot showing PD-1 expression in CD8+ T cells. (g) Representative images and comparisons of tumoral PD-L1+ cell numbers. Values are presented as the mean ±SD. *p < .05 versus control. One-tailed Student’s t-test (c) and two-tailed Student’s t-test (e-g) were used. Scale bars, 50 μm. GO, Gene Ontology; GESA, Gene Set Enrichment Analysis; PD-1, program cell death protein 1; PD-L1, program cell death ligand 1
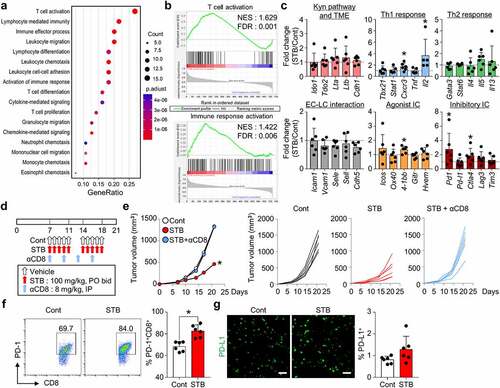
Figure 5. STB differentially remodels the tumor immune microenvironment compared with epacadostat. Mice were subcutaneously implanted with CT26 tumor cells and orally treated with vehicle, STB, and epacadostat. (a) Representative images and comparisons of intratumoral Kyn expression in tumors. (b) Comparisons of CD11b+CD11c+ DC, CD11c+CD86+ DC, and CD3−CD49b+ NK cell fractions in tumors. (c) Comparisons of CD8+ T cell, CD8+GzB+ T cell and CD8+ICOS+ T cell fractions in tumors. (d) Representative images and comparisons of CD31+ tumor blood vessels. (e) Diagram depicting the mechanism by which STB-C017 facilitates T-cell-mediated immunity within TME. Values are presented as the mean ±SD. *p < .05 versus control; #p < .05 versus epacadostat. A two-tailed Student’s t-test (a-d) was used. Scale bars, 50 μm. DC, dendritic cell; NK, natural killer
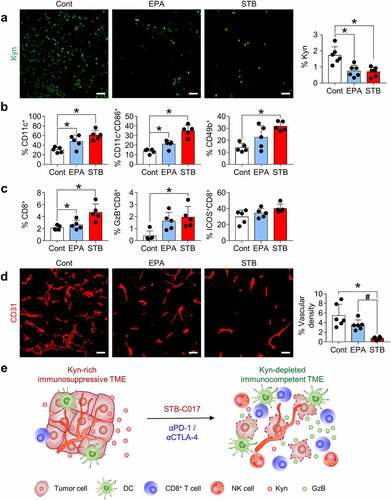
Figure 6. STB synergizes with immune checkpoint inhibitors (ICIs) to enhance cancer immunity and suppress tumor growth. Mice were subcutaneously implanted with CT26 tumor cells and treated with STB and anti-PD-1 and/or anti-CTLA-4 antibodies. (a) Diagram of the treatment schedule. Arrows indicate treatment. (b, c) Comparison of CT26 tumor growth in mice. The number of tumor-free mice (complete response, CR) is indicated for each group. (d, e) Representative images (d) and comparisons (e) of intratumoral CD8+ T cells and CD31+ tumor blood vessels. (d, f) Representative flow cytometry analysis plot (d) and comparisons (f) of CD8+ T cell and CD4+Foxp3+CD25+ (Treg) in tumor. Values are presented as the mean ±SD. *p < .05 versus control. A one-tailed Student’s t-test (b, e, f) was used. Scale bars, 50 μm
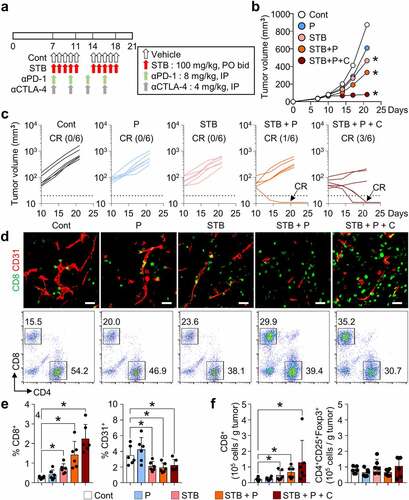
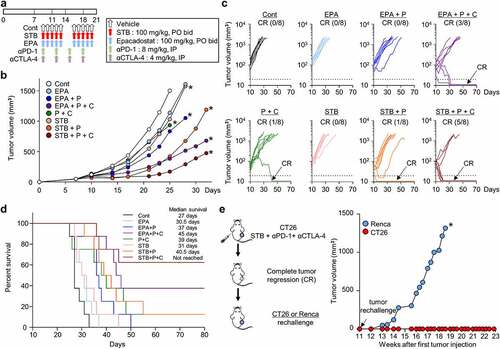
Figure 7. STB in combination with ICIs was more efficient than epacadostat-based combinations, inducing more durable and protective anti-tumor immunity. Mice were subcutaneously implanted with CT26 tumor cells and treated with STB, epacadostat, and anti-PD-1 and/or anti-CTLA-4 antibodies. (a) Diagram of the treatment schedule. Arrows indicate treatment. (b, c) Comparison of CT26 tumor growth in mice. Mean (b) and individual (c) tumor growth curves over time. The number of tumor-free mice (CR) is indicated for each group. (d) Kaplan-Meier plot for overall survival. (e) Comparison of tumor growth after injection of CT26 or Renca tumor cells into mice with complete tumor regression. Values are presented as the mean ±SD. *p < .05 versus control. Two-tailed Student’s t-test (b, e) and log-lank test (d) were used