Figures & data
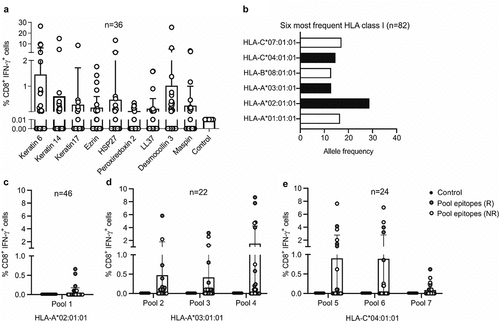
Figure 1. Screening of predicted CD8 epitopes in ICI-treated patients with NSCLC. (a) NSCLC antigens were predicted using a novel approach of tissue profiling and bioinformaticsCitation6 and used to stimulate PBMC cultures of ICI-treated patients with NSCLC (n = 36). The frequency of CD8+ IFN-γ+ T cells among total CD8+ T cells was detected as a measure of T cell activation for each stimulation. These frequencies were compared to the background frequency of CD8+ IFN-γ+ cells in medium-only negative control cultures (Kruskal Wallis test; keratin 6, p = .70; keratin 14, p = .02; keratin 17, p = .002; ezrin, p = .05; HSP27, p = .01; peroxiredoxin 2, p = .0004; LL37, p = .01; desmocollin 3, p = .72; maspin, p = .01). (b) HLA class I typing of the patient cohort was carried out to identify the most frequent HLA class I alleles. The alleles shown in black bars were selected for further analysis. (c-e) An initial screen was carried out by pooling the predicted CD8 epitopes into seven different peptide pools. Pool 1 contained epitopes predicted for HLA-A 02:01 (c), pools 2–4 contained epitopes for the nine antigens predicted for HLA-A 03:01 (d) and pools 5–7 contained epitopes predicted for HLA-C 04:01 (e). Responders (r) are shown in red and non-responders (NR) in white. Pool 1 contained epitopes from all predicted antigens; pools 2 and 5 contained epitopes from keratin 6, keratin 17 and keratin 14; pools 3 and 6 contained epitopes from LL37, ezrin and HSP27; pools 4 and 7 contained epitopes from desmocollin 3, maspin and peroxiredoxin 2. The frequency of CD8+ IFN-γ+ T cells among total CD8+ T cells was detected as a measure of T cell activation for each stimulation. These frequencies were compared to the background frequency of CD8+ IFN-γ+ cells in medium-only negative control cultures

Figure 2. ICI-treated patients with NSCLC harboring CD8+ T cell responses to predicted CD8 epitopes have improved survival. (a) Identified CD8 epitopes for the predicted antigens for HLA-A 03:01 that are shared among patients (i.e. two or more patients showed a CD8+ T cell response to a specific epitope). (b) Identified CD8 epitopes for the predicted antigens for HLA-C 04:01 that are shared among patients (as in A). For (a-b) PBMCs from patients with NSCLC were stimulated with the single epitopes of the predicted tumor antigens. T cell activation upon stimulation was detected by measuring ex vivo IFN-γ production by CD8+ T cells. The background frequency of CD8+ IFN-γ+ cells in medium-only negative control cultures was subtracted for all stimulations. IMIT refers to the patient ID. (c-d) Patients positive for HLA-A 03:01 and HLA-C 04:01 with CD8+ T cell responses to the predicted epitopes (n = 17) had significantly better OS (HR = 0.37 [95% CI, 0.20–0.68], log-rank p-value = 0.01) (c) and PFS (HR = 0.37 [95% CI, 0.20–0.68], log-rank p-value = 0.01) (d) compared to patients with the same HLAs that did not have a CD8+ T cell response to the epitopes (n = 71)
![Figure 2. ICI-treated patients with NSCLC harboring CD8+ T cell responses to predicted CD8 epitopes have improved survival. (a) Identified CD8 epitopes for the predicted antigens for HLA-A 03:01 that are shared among patients (i.e. two or more patients showed a CD8+ T cell response to a specific epitope). (b) Identified CD8 epitopes for the predicted antigens for HLA-C 04:01 that are shared among patients (as in A). For (a-b) PBMCs from patients with NSCLC were stimulated with the single epitopes of the predicted tumor antigens. T cell activation upon stimulation was detected by measuring ex vivo IFN-γ production by CD8+ T cells. The background frequency of CD8+ IFN-γ+ cells in medium-only negative control cultures was subtracted for all stimulations. IMIT refers to the patient ID. (c-d) Patients positive for HLA-A 03:01 and HLA-C 04:01 with CD8+ T cell responses to the predicted epitopes (n = 17) had significantly better OS (HR = 0.37 [95% CI, 0.20–0.68], log-rank p-value = 0.01) (c) and PFS (HR = 0.37 [95% CI, 0.20–0.68], log-rank p-value = 0.01) (d) compared to patients with the same HLAs that did not have a CD8+ T cell response to the epitopes (n = 71)](/cms/asset/038e4bfe-e27b-4850-88de-305f03353df4/koni_a_2006893_f0002_oc.jpg)
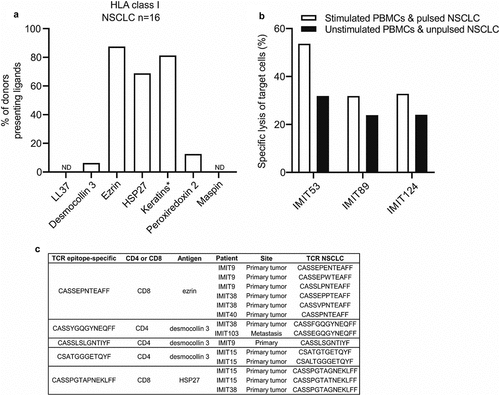
Figure 3. Predicted peptide antigens are naturally presented on HLA class I of human NSCLC tissue, and epitope-specific T cells are found in ICI-treated lung tumors. (a) Frequency of donors in which HLA class I ligands derived from the predicted NSCLC antigens in NSCLC tissue (n = 16) were detected by mass spectrometry. *HLA ligands from keratin 6, keratin 14 and keratin 17 could not be assigned to a single keratin protein sequence due to their high sequence similarity and were therefore grouped together as keratins. (b) PBMC cultures from patients with NSCLC (n = 3) were stimulated with single predicted CD8 epitopes and co-cultured overnight with an immortalized HLA class I-matched NSCLC cell line pulsed with the same peptides. The following day the frequency of NSCLC cell death was analyzed using the Apotracker green/propidium iodide apoptosis detection kit. (c) PBMC cultures from patients with NSCLC were stimulated with single predicted CD8 epitopes and CD8+ IFN-γ+ T cells were sorted after the stimulations and used for TCR sequencing. IMIT refers to the patient ID. The epitope-specific TCRs were compared with the TCRs found in human NSCLCs (primary lung tumors or metastases) treated with ICI therapy (n = 5). A fuzzy string matching analysis using a maximal edit distance of one was carried out to identify highly similar TCRs in sorted T cells and NSCLCs. Edit distance is defined as the Levenshtein distance, which is the number of removals, insertions, or substitutions of a character needed to transform one string into the other

