Figures & data
Figure 1. Generation and characterization of CTLA4-CD28 transgenic mice. (a) A schematic representation of the structure of CTLA4-CD28 fusion gene driven by the lck distal promoter. The arrows indicate positions of oligonucleotide primers used for genotyping by PCR. (b) Real-time PCR analysis of the transgene expression. Thymocytes from 2 week-old mice were sorted for indicated populations by staining with anti-CD4 and CD8 (n = 3). (**) represents P-value <0.01 from t-test. (c) Immublotting showing expression of the transgenic protein in lymphoid and non-lymphoid organs of a 2 week-old mouse. (d) Immunostaining of lymph nodes from a wild type (WT) littermate and transgenic (TG) mouse with anti-HA antibody. (e) Immunoblotting (IB) with indicated antibodies following immunoprecipitation (IP) with anti-HA antibody. IgG was used in control immunoprecipitation.
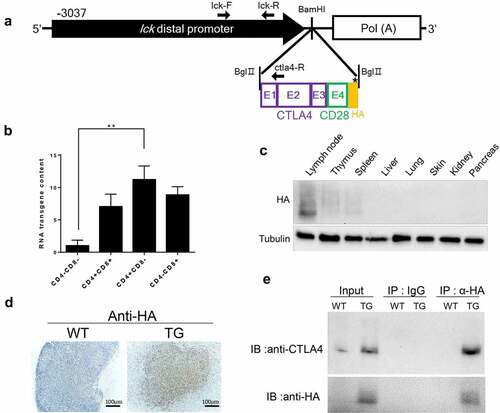
Figure 2. Gross pathological phenotypes of CTLA4-CD28 transgenic mice. (a) A 12 week-old CTLA4-CD28 transgenic mouse with typical skin lesions. (b) Kaplan-Meier survival curves of wild-type littermates (n = 19) and CTLA4-CD28 transgenic mice (n = 19). P-value <0.0001 from log-rank test. (c) Lymph node (left) and spleen (right) of TG mice (n = 7; red arrow heads) compared with organs from age-matched WT littermates (n = 7). (****) represents P-value <0.0001, and (*) represents P-value <0.05 from t-test.
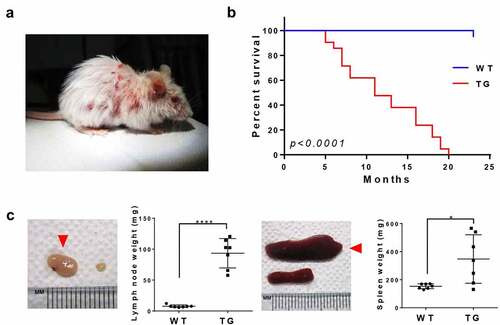
Figure 3. Immunoproliferation in CTLA4-CD28 transgenic mice. (a) Lymph nodes from 2 WT and TG mice were used for examination of TCR β chain diversity. 5ʹRACE PCR amplification of rearranged TCR β chain was followed by Gene Scan analyses. (b) Flow cytometric analyses with pan T cell marker (CD3) in combination with T cell activation markers (CD25, CD44 or CD69) or with a naïve T cell marker (CD62L). CD19 was used as a B cell marker. In the case of T cells, numbers represent mean percentage + SD of double positive cells from three independent experiments. For B cells, numbers represent mean percentage + SD of CD19+ cells from three independent experiments. In all cases, the differences between WT littermates and TG mice were statistically significant (P-value < 0.05). (c) H&E and immunostaining for CD3, CD4, CD8 and PAX5 in the lymph node and spleen of a 12 week-old TG mouse. (d) H&E and immunostaining for CD3, CD4, CD8 and PAX5 in the skin and lung of a TG mouse.
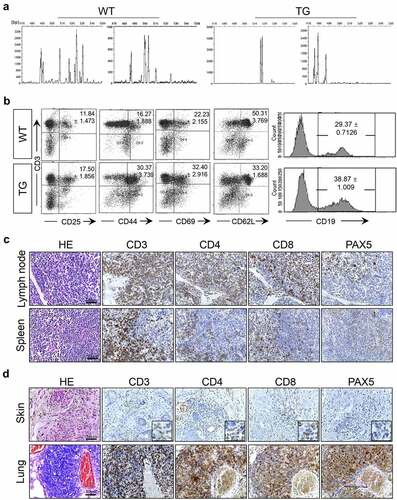
Figure 4. Histopathology of NSG mice transplanted with spleen cells from CTLA4-CD28 transgenic mice. (a) An NSG mouse with typical skin lesions in 9 weeks post transplantation. (b) Size and weight of spleen from NSG control and transplanted mice (n = 3 each). (*) represents P-value <0.05 from t-test. (c) H&E and immunostaining for CD3, CD4, CD8 and PAX5 in the spleen. Areas in the yellow box are shown in enlarged forms in the lower panels. (d) H&E and immunostaining for CD3, CD4, CD8 and PAX5 in the skin.
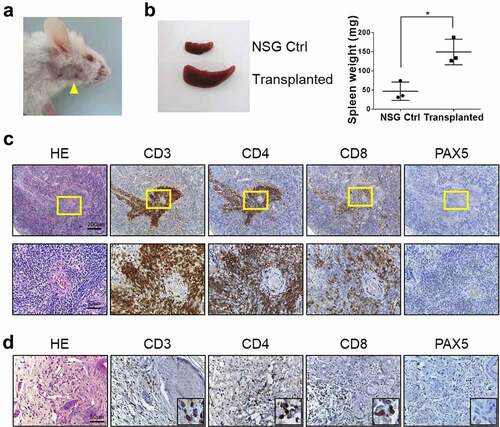
Figure 5. Histopathology of NSG mice transplanted with CD4+ or CD8 + T cells from CTLA4-CD28 transgenic mice. (a) Skin lesions (yellow arrowhead) seen in an NSG mouse injected with CD4+ cells (top); a mouse injected with CD8 + T cells is shown below. (b) The spleen from a NSG mouse injected with CD4+ cells compared to that from a mouse injected with CD8 + T cells. The graph on the right side summarizes results from multiple samples (n = 3). (*) represents P-value <0.05 from t-test. (c) Spleens from mice transplanted with CD4+ or CD8+ cells were stained for CD3, CD4 and CD8. (d) H&E and immunostaining for CD4 and CD8 in the liver and skin of mice transplanted with CD4+ or CD8 + T cells.
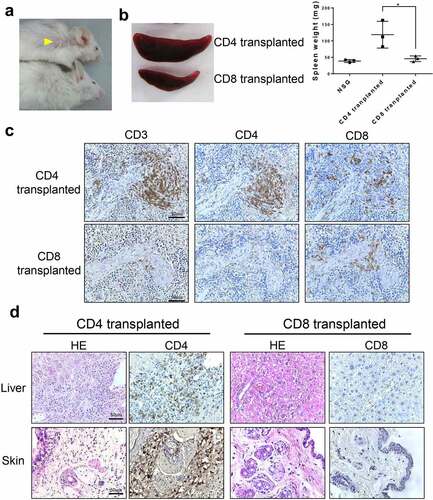
Figure 6. Transcriptome analysis of CD4 + T cells from CTLA4-CD28 transgenic mice. (a) Gene set enrichment analysis (GSEA) result using the hallmark gene sets of MSigDB. Significant gene sets with FDR < 0.05 are shown in the bar plot. Gene sets with positive and negative enrichment scores were indicated in red and blue colors, respectively. (b) Enrichment plots of representative gene sets for the indicated pathways. (c) Distribution of pairwise correlation coefficients between gene expression profiles of CD4+ cells from TG mice and T cell lymphoma patients of 5 tumor subtypes. (d) Enrichment plots of representative gene sets for the indicated cell types.
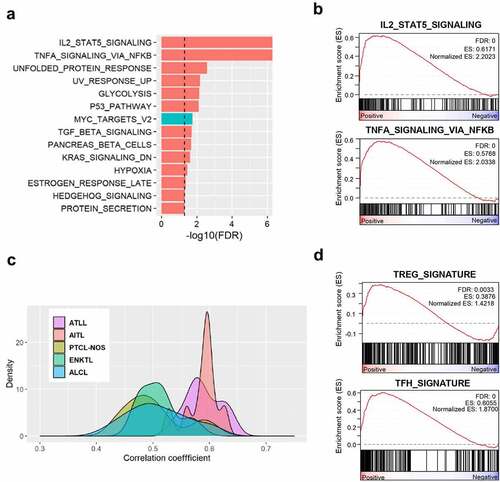
Figure 7. ATLL-like phenotypes in CTLA4-CD28 transgenic mice. (a) Flow cytometric analysis for CD25+ FOXP3+ Treg cells among CD3+ CD4+ cells from WT littermates and TG mice. The graph on the right side summarizes results from multiple samples (n = 3). (*) represents P-value <0.05 from t-test. Lymph nodes from a WT mouse and TG mouse (b), spleens from a wild type NSG (NSG WT) mouse and CD4 + T cell-transplanted NSG mouse (c), liver and pancreas of a CD4 + T cell-transplanted NSG mouse (d) immunostained for FOXP3. Areas in the yellow box are shown in enlarged forms in the panels to the right.
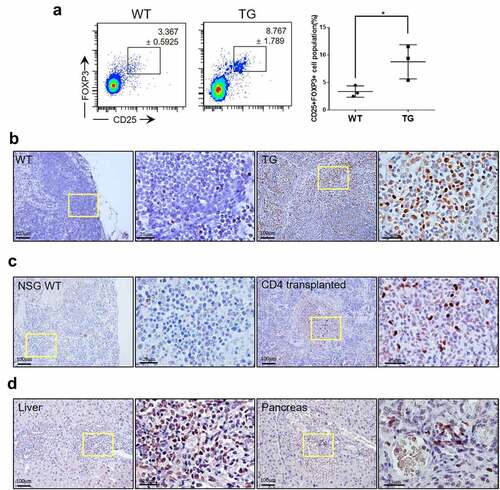
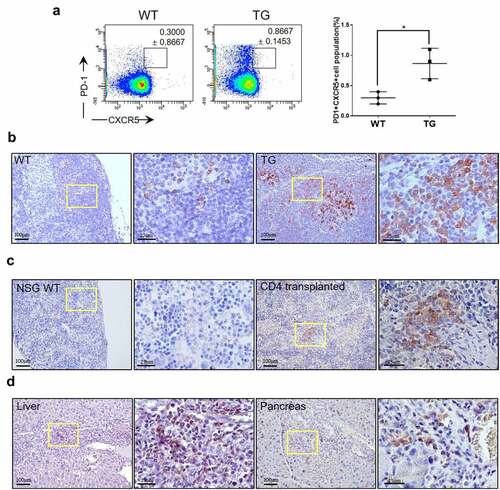
Figure 8. AITL-like phenotypes in CTLA4-CD28 transgenic mice. (a) Flow cytometric analysis for PD-1+ CXCR5+ cells among CD4+ B220- CD11b- cells from WT littermates and TG mice. The graph on the right side summarizes results from multiple samples (n = 3). (*) represents P-value <0.05 from t-test. Lymph nodes from a WT mouse and TG mouse (b), spleens from a wild type NSG (NSG WT) mouse and CD4 + T cell-transplanted NSG mouse (c), liver and pancreas of a CD4 + T cell-transplanted NSG mouse (d) immunostained for PD-1. Areas in the yellow box are shown in enlarged forms in the panels to the right.