Figures & data
Figure 1. Scheme of TWEAKR-KSPi-ADCs, its metabolite and the small molecule KSPi.
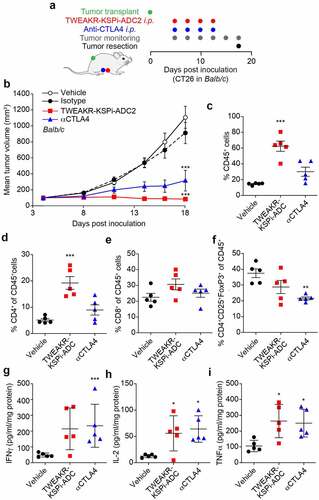
Figure 2. TWEAKR-KSPi-ADC controls tumor growth in an immune-dependent fashion in TWEAKR expressing CT26.
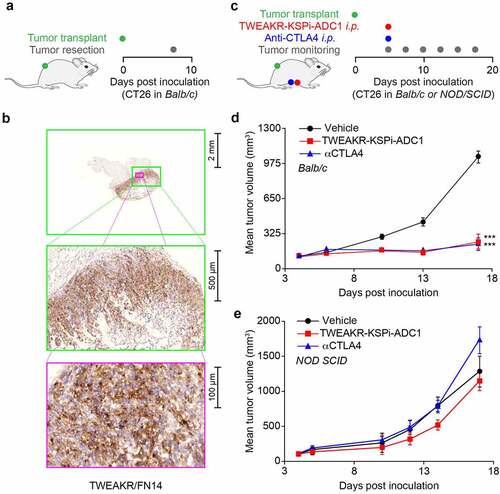
Table 1. In vivo treatment schedule and outcome
Figure 3. Prediction of the potential of KSPi to induce immunogenic cell death.
Figure 4. Biosensor cells for the immunogenic cell death fingerprinting (a-c) Human colorectal adenocarcinomas HT29 cells were either stained with quinacrine to assess ATP release, or were genetically modified to express CALR-GFP as surrogate marker for CALR exposure, HMGB1-GFP to measure nuclear HMGB1 exodus or GFP expression under the control of the type-I interferon-induced GTP-binding protein MX1 promoter to measure type-I interferon responses in a high throughput fashion. A schematic representation is depicted in (a) and representative images of HT29 cells untreated (CTRL) or treated with the KSPi or mitoxantrone are shown in (b). Size bar equals 10 µm. (c) To assess ICD fingerprints, HT29 cells were treated with the indicated concentrations of KSPi. Mitoxantrone and recombinant IFNα at the indicated concentrations were used as positive controls. The data is plotted together with solvent controls (vehicle) in form of a heatmap. White boxes indicate: “data not available”.
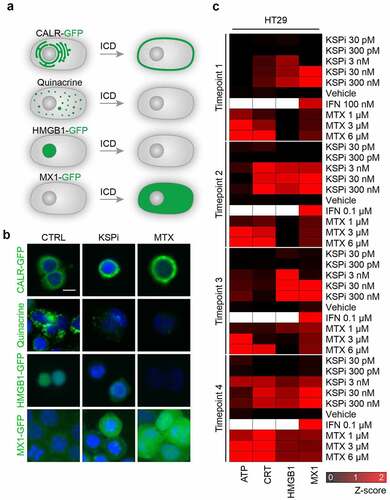
Figure 5. TWEAKR-KSPi-ADC triggers anticancer immune responses.