
Figures & data
Figure 1. Tumoral-secreted IL-1α promotes tumor growth in murine HCC models.
(a) Immunofluorescence staining detection of the expression of IL-1α (red) in hepa1-6 transfected cells (green). Nuclei were stained by DAPI (blue color). Scale bar: 50 µm. (b) The secretion of IL-1α in supernatant of hepa1-6 transfected cells was determined by ELISA assay. (c) The cell proliferation ability was determined by CCK-8 assay. (d) Mice (n = 5 each group) were injected subcutaneously with hepa1-6-secreted IL-1α or -vector cells. The representative of tumor morphology, tumor sizes and tumor weight are shown. (e) Mice (n = 5–7 each group) were injected with hepa1-6-secreted IL-1α or -vector cells via hydrodynamic cell delivery method. Mice were sacrificed 3 weeks later. The representative of tumor morphology, the numbers of tumor nodules and liver weight were shown. The data shown are representative of three experiments. Data are presented as means ± SD. * p < .05, ***p < .001.
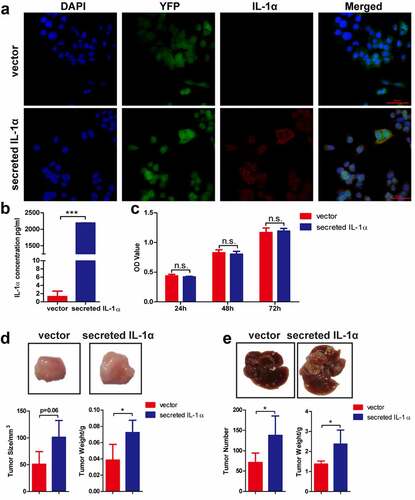
Figure 2. Tumoral-secreted IL-1α inhibits T and NK cell activation in vivo.
Splenocytes and intrahepatic leukocytes were isolated from orthotopic HCC mice (n = 5–7 each group) 1 week after tumor injection. The activated (CD69+), naïve, effector and memory cells of CD4+ T or CD8+ T cells in spleen (a) and liver (b) were assessed by flow cytometry. NK, activated NK cells, DC and activated DC in spleen (c) and liver (d) were assessed by flow cytometry. (e) Non-radioactive cytotoxicity assay was used to evaluate the cytotoxic activity of CD8+ T cells sorted from the spleen of tumor-bearing mice. Data are presented as means ± SD. * p < .05, ** p < .01, *** p < .001.
Figure 3. Tumoral-secreted IL-1α increases MDSCs in vivo.
Splenocytes and intrahepatic leukocytes were isolated from orthotopic HCC mice (n = 5–7 each group). CD11b+Gr1+ MDSCs in spleen and liver of the tumor-bearing mice expressing secreted IL-1α or vector control were analyzed by flow cytometry 1 week (a) or 3 weeks (b) after tumor injection. (c) The percentages and total numbers of PMN-MDSCs and M-MDSCs were analyzed by flow cytometry. (d) CIBERSORT analysis of the relationship between IL1A expression and MDSCs infiltration in HCC patients. (e) Multiple chemokines and cytokines expressions were assessed by qPCR from tumor cells. (f) MDSCs were preincubated with CXCR2 inhibitor SB265610 for 30 min to block CXCR2 interaction with its ligands. Transwell assay was performed to detect the chemotaxis ability. (g) Mice were treated with SB265610 at a dose of 2 mg/kg mouse body weight every 3 days (n = 5 each group). The tumor size and weight were measured. (h) The percentage and total number of tumoral MDSCs infiltration was detected by flow cytometry. (i) Tumor-bearing mice expressing secreted IL-1α were injected with PBS or GEM (n = 5–7 each group). The numbers of tumor nodules and liver weight were shown. (j) The depletion of MDSCs was confirmed by flow cytometry. The data shown are the representative of three experiments. Data are presented as means ± SD. * p < .05, ** p < .01, *** p < .001.
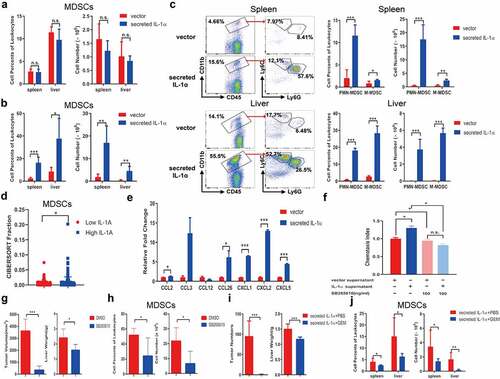
Figure 4. Systemic administration of recombinant IL-1α inhibits tumor development.
Orthotopic murine HCC model was established by hydrodynamic cell delivery with hepa1-6 cells. Tumor-bearing mice were injected with PBS or recombinant IL-1α protein (n = 5–7 each group). (a) The livers were collected from mice 3 weeks after tumor cell injection, and representative of tumor morphology, the numbers of tumor nodules and liver weight were shown. (b) MDSCs in spleen and liver from mice 3 weeks after tumor injection were analyzed by flow cytometry. Representative FACS plots were shown. The activated, naïve, effector and memory cells of CD4+ T or CD8+ T cells in spleen (c) and liver (d) isolated from mice 1 week after tumor injection were analyzed by flow cytometry. The data shown are the representative of three experiments. Data are presented as means ± SD. * p < .05, ** p < .01, *** p < .001.
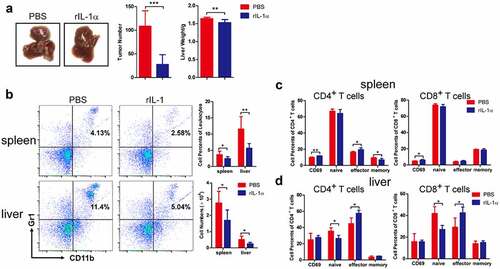
Figure 5. Secreted IL-1α promotes T cell activation in vitro.
Naïve T cells were co-cultured directly (a) or in transwell system (b) with irradiated hepa1-6 expressing secreted IL-1α. Meanwhile, naïve T cells were also stimulated with anti-CD3/CD28 antibodies. Activated, naïve, effector and memory cells of CD4+ T and CD8+ T cells were assessed by flow cytometry. (c) Naïve T cells stimulated with anti-CD3/CD28 antibodies were culture with 25 ng/mL recombinant IL-1α protein (secreted form). Activated, naïve, effector and memory cells of CD4+ T and CD8+ T cells were assessed by flow cytometry. (d) CD8+ T cells were sorted from splenocytes stimulated with hepa1-6 cells lysate with or without IL-1α protein. Non-radioactive cytotoxicity assay was used to evaluate the cytotoxic activity of CD8+ T cells. The data shown are the representative of three experiments. Data are presented as means ± SD. * p < .05, ** p < .01, *** p < .001.
Figure 6. Calpain 1 is essential for tumoral-secreted IL-1α-mediated HCC progression.
Hepa1-6 cells stably expressing pro-IL-1α were generated by lentivirus transfection and the expression of CAPN1 was knocked out by CRISPR/Cas9 technology. The expression of calpain 1 at mRNA and protein levels were detected by qPCR (a) and western blot (b), respectively. (c) Calpain activity in control and calpain 1 KO cells were detected by calpain-glo activity kit. (d) IL-1α expression level in control and calpain 1 KO cells were assessed by ELISA. (e) Control and Calpain 1 KO cells were seeded for 24, 48 and 72 hours. The cell proliferation was determined by CCK-8 assay. (f) Control and Calpain 1 KO cells were irradiated with UV for 45 min, the apoptosis rate was assessed by Annexin V & DAPI staining. The early apoptosis was defined as Annexin V+DAPI−, the late apoptosis was defined as Annexin V+DAPI+. (g) Mice were orthotopically injected with control or calpain 1 KO hepa1-6-pro IL-1α cells. Two weeks later, mice were sacrificed for tumor assessment. The representative of tumor morphology, tumor sizes and tumor weight were shown (n = 5). The level of IL-1α in the tumor tissue (h) and serum (i) were assessed by ELISA. (J) The percentage and total number of MDSCs in the liver were detected by flow cytometry. The data shown are the representative of three experiments. Data are presented as means ± SD. * p < .05, *** p < .001.
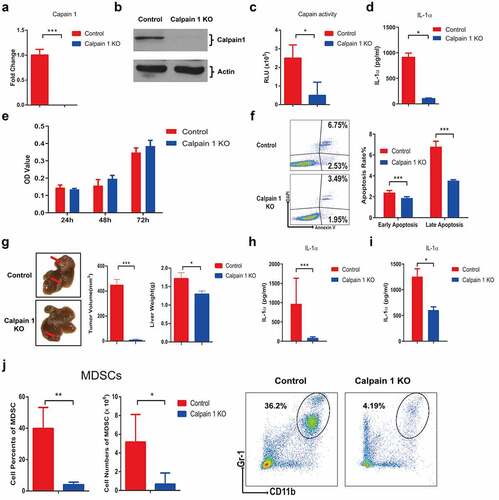
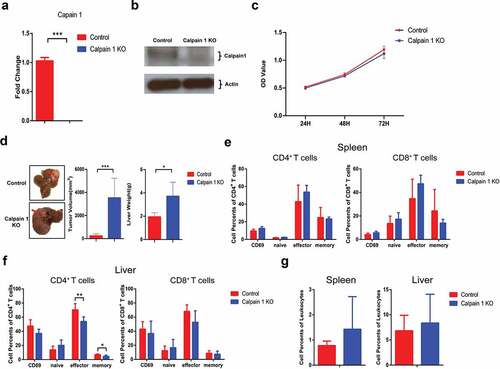
Figure 7. Calpain 1 KO promoted HCC development in parental hepa1-6 cells.
CAPN1 was knocked out by CRISPR/Cas9 technology in the parental hepa1-6 cells. The expression of calpain 1 at mRNA and protein levels were detected by qPCR (a) and western blot (b), respectively. (c) The proliferation of hepa1-6-Calpain 1 KO cells were assessed by CCK-8. (d) Mice were orthotopically injected with control or calpain 1 KO hepa1-6 cells. Two weeks later, mice were sacrificed for tumor assessment. The representative of tumor morphology, tumor sizes and tumor weight were shown (n = 5). The activated, naïve, effector and memory cells of CD4+ T or CD8+ T cells in spleen (e) and liver (f) were analyzed by flow cytometry. (g) The percentage of MDSCs was detected by flow cytometry. The data shown are the representative of three experiments. Data are presented as means ± SD. * p < .05, *** p < .001.
Supplemental material