Figures & data
Figure 1. Generation and in vitro characterization of OAd-MUC16-BiTE. (a) Graphical illustration of the features of OAd-MUC16-BiTE and its parental OAd. (b) HEY cells were infected with the specified virus (MOI = 10). Cells were collected 48 h after infection, and western blotting was used to analyze 6× His. HEY cells without the virus as a blank control. β-actin was used as the endogenous control. (c) HEY cells were infected with the indicated virus (MOI = 100). The conditioned medium was harvested at 0 d, 1 d, 2 d, 3 d, and 4 d after infection. DNA extraction and qPCR was performed to detect the copy number of the E4 gene as a measure of viral replication. (d) Cell viability was assessed using CCK8 assays 24 h, 48 h, 72 h, and 96 h after infection. Data are shown as the percentage of cells alive after infection with OAd or OAd-MUC16-BiTE at the indicated MOIs relative to the non-infected cells (control values were set to 100% viability). Data represents the mean ± SD in triplicates (c, d). OAd, oncolytic adenovirus; BiTE, bispecific T-cell engager; ITR, inverted terminal repeats; ψ, virus packaging signal; CMV, cytomegalovirus promoter; SA, Simian virus; Ig, immunoglobulin; H, heavy chain; L, light chain; h, human; MOI, multiplicity of infection; ns, not significant; qPCR, quantitative PCR.
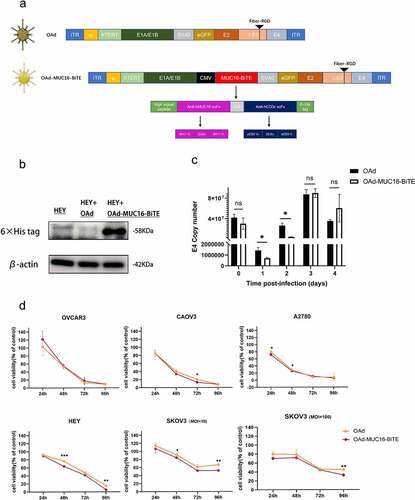
Figure 2. MUC16-BiTE expressed by OAd-MUC16-BiTE–infected cells enhances PBMC-derived T-cell functions. (a)Flow cytometry results showing the expression of MUC16 (MUC-CD) on SKOV3/SKOV3-MUC16 and HEY/HEY-MUC16 cells. (b) Results of luciferase activity-based cytotoxicity tests. (c) Flow cytometry results showing the surface expression of CD69 and CD25 on CD4+ and CD8 + T cells. (d) Proliferative response of CFSE-stained T cells co-cultured with SKOV3 or SKOV3-MUC16 cells and incubated with or without a specified supernatant. Fluorescence was measured by FACS analysis after incubation for 72 h. Untreated T ceslls were used as the negative control, whereas Dynabeads CD3/CD28-stimulated T cells were used as the positive control. (e) Representative flow cytometric plot showing the Ki67 expression of CD3 + T cells. (f) CD107a‐specific antibodies were added to the culture media during co-culture, and degranulation was assessed by flow cytometry. (g) Levels of human IL-2, TNF-α, IFN-γ, granzyme B, GM-CSF, IL-10 and TGF-β as assessed by flow cytometry. (b-c) and (f-g) In the presence of different supernatants, PBMC-derived unstimulated T cells were co-cultured with SKOV3/SKOV3-LUC or SKOV3-MUC16 (E:T = 5:1) for 24 h, whereas (e) for 72 h. (c, e) T cells stimulated by Dynabeads CD3/CD28 were used as the positive control. (b, f-g) co-cultures without supernatants were used as empty controls. (b-g) Each condition was measured in biological triplicates, and data represent the mean ± SD. CON, control; FACS, fluorescence-activated cell sorting; IL-2, interleukin 2; IL-10, interleukin 10; TNF-α, tumor necrosis factor alpha; IFN-γ, interferon gamma; GM-CSF, granulocyte macrophage-colony stimulating factor; TGF-β, transforming growth factor β.
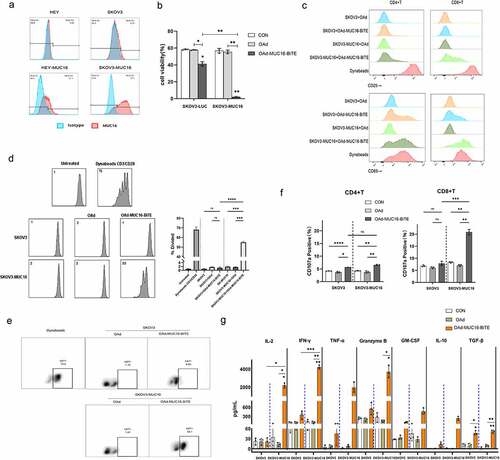
Figure 3. OAd-MUC16-BiTE–mediated oncolysis enhances T-cell–mediated tumor cell killing and bystander effect. (a) SKOV3-LUC/SKOV3-MUC16 or HEY-LUC/HEY-MUC16 cells were infected with OAd or OAd-MUC16-BiTE; uninfected cells were used as the control. PBMC-derived T cells (5:1) was added 24 h after infection and incubated for 24 h.(b) HEK293A cells infected with OAd or OAd-MUC16-BiTE were co-cultured with HEY-MUC16 or SKOV3-MUC16 cells and PBMC-derived T cells (5:1) for 24 h and 48 h. A co-culture without T cells served as the negative control. (a-b) Luciferase activity was measured using a microplate reader. Data represent the mean ± SD in triplicates. CON, control.
Figure 4. Lytic capability of oncolytic adenovirus in ex vivo tumor cultures from patients with resected OC. (a) Representative IHC images showing MUC-CD expression of OC patients. Scale bar: 50 μm. (b) PD-1, TIM-3, LAG-3, and TIGIT expression in T cells were evaluated by flow cytometry. Data are shown as percentages of CD3+ cells. Data are mean ± SD, n = 5. (c) Ex vivo tumor cultures were incubated with oncolytic adenovirus for 96 h (MOI = 100). Viability was assessed on the indicated days, non-infected as negative control. Data represent the mean ± SD in triplicates. (d) Ex vivo tumor cultures were incubated with or without oncolytic adenovirus for 72 h (MOI = 100). IL-10 and TGF-β levels of the supernatant were analyzed (n = 5). OC, Ovarian cancer; PD-1, programmed death 1; LAG3, lymphocyte activation gene-3; Tim-3, T cell immunoglobulin and mucin domain-3; TIGIT, T cell immunoglobulin and ITIM domain.
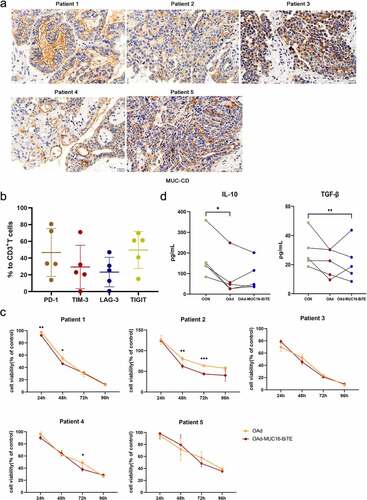
Figure 5. OAd-MUC16-BiTE enhances antitumor efficacy in vivo. (a) Schematic experimental design. After treatment, tumor tissues were collected at the indicated time points. (b, e) Photographs of tumors after treatment, (b) the CDX model, (d) the PDX model. (c, f) Tumor volume and (d, g) mass were measured (Data represent the mean ± SD, n = 5). (c, d) the CDX model, (f, g) the PDX model. (h, i) IHC-stained tumor sections of the PDX model. Representative images of the virus HEXON (h) and 6× His tag (i). Scale bar: 50 μm.(j) HE staining of the major organs (heart, liver, spleen, lung, kidney and stomach) of C57/BL6 mice after different treatments. The scale bars are 100 μm. s.c. subcutaneous; i.v., intravenous; i.t., intratumoral; CDX, cell-derived xenograft; PDX, patient-derived xenograft; IHC, immunohistochemistry; HE, hematoxylin and eosin.
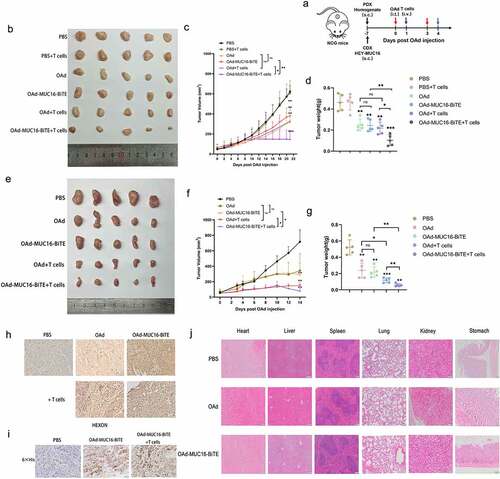
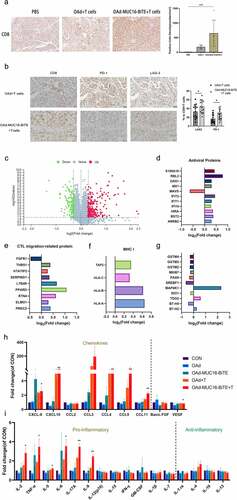
Figure 6. OAd-MUC16-BiTE increases T cell infiltration and reverses TME. (a) Representative IHC images showing CD8 lymphocytes in PDX tumors. Scale bar: 50 μm. CD8+ cell density (cells/mm2) of each tissue slice (n = 5) is shown right. Data are shown as the mean ± SD. (b) IHC of immune markers, CD8, PD-1, and LAG-3 in PDX tumors. Scale bar, 50 μm. Percentages of PD-1+ and LAG-3+ cells among CD8 + T cells are shown right. Number of positive cells from randomly chosen 5 fields/tumor section/mouse were counted, and the mean ± SD of all fields across the mice (N = 3/group) are presented. (c) Volcano plot of DEPs between the two groups (OAd-MUC16-BiTE + T cells vs. PBS). Each point represents a detected protein. The red dots indicate the upregulated proteins; green dots, downregulated proteins; and gray dots, non-significant DEPs. The thresholds for significant differential expression were set at q < 0.05 and fold-change > 1.2. DEPs related to antiviral activity (d), T cell migration (e), and MHC I antigen processing and presentation(f). (g) DEPs related to T cell function and platinum resistance. (h) Chemokines (left) and angiogenic factors (right). (i) Pro-inflammatory factors (left) and anti-inflammatory factors (right). (h, i) Data are shown as the mean ± SD in triplicates. DEP, differentially expressed protein; MHC, major histocompatibility complex; CTL, cytotoxic T lymphocytes; CON, control; CXCL, chemokine CXC motif ligand; CCL, chemokine C-C motif ligand; VEGF, vascular endothelial growth factor; FGF, fibroblast growth factor.