
Figures & data
Figure 1. High expression of CD8A in peripheral blood is correlated with favorable prognosis and response to DCVAC in mCRPC patients in SP005. (a) Unsupervised hierarchical clustering of 804 mCRPC patients in SP005 based on the expression of 93 genes classified into clusters related to B cells, cytotoxicity, DCs, immune populations, immunosuppression, NK cells, T cell activation, and TH1 and TH2 signatures. (b, c) OS of 260 patients from the SOC arm (b) and 544 patients from the DCVAC arm (c) following stratification by unsupervised hierarchical clustering into low and high inflammatory clusters. (d, e) Direct comparison of OS of SOC and DCVAC patients following stratification by unsupervised hierarchical clustering into low (d) and high inflammatory clusters. (f) OS of 804 mCRPC patients stratified by the median CD8A expression and study arm. Survival curves were estimated using the Kaplan–Meier method and differences between groups were evaluated using the log-rank test. The numbers of patients at risk and p values are reported.
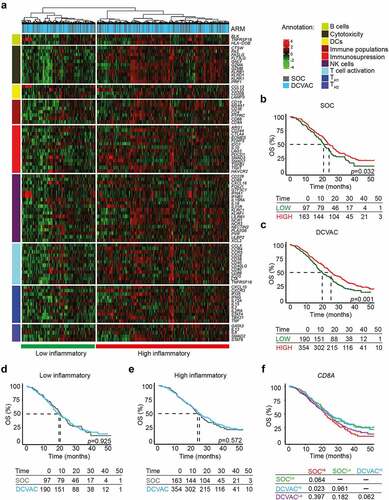
Table 1. Univariate Cox proportional hazard analyses for OS in mCRPC patients from the SOC and DCVAC arms in SP005.
Table 2. Univariate Cox proportional hazard analyses for OS in NSCLC patients from the SOC and DCVAC arms in SLU01.
Figure 2. High expression gene signatures associated with B cells, CD8A, cytotoxicity, and DCs is correlated with favorable prognosis and response to DCVAC in NSCLC patients in SLU01. (a) Unsupervised hierarchical clustering of 103 NSCLC patients in SLU01 based on the expression of 93 genes classified into clusters related to B cells, cytotoxicity, DCs, immune populations, immunosuppression, NK cells, T cell activation, and TH1 and TH2 signatures. (b, c) OS of 35 patients from the SOC arm (b) and 68 patients from the DCVAC arm (c) following stratification by unsupervised hierarchical clustering into low and high inflammatory clusters. (d, e) Direct comparison of OS of SOC and DCVAC patients following stratification by unsupervised hierarchical clustering into low (d) and high inflammatory clusters (e). (f) OS of 103 NSCLC patients stratified by the median expression of genes associated with B cell signature, CD8A expression, cytotoxicity, and DCs, and study arm. Survival curves were estimated using the Kaplan–Meier method, and differences between groups were evaluated using the log-rank test. The numbers of patients at risk and p values are reported.
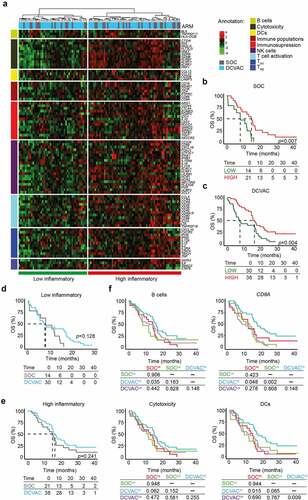
Figure 3. Low expression of genes associated with immunosuppression and TH2 signature is correlated with an improved response to DCVAC in EOC patients in SOV01. (a) Unsupervised hierarchical clustering of 93 EOC patients in SOV01 based on the expression of 93 genes classified into clusters related to B cells, cytotoxicity, DCs, immune populations, immunosuppression, NK cells, T cell activation, and TH1 and TH2 signatures. (b, c) PFS of 28 patients from the SOC arm (b) and 65 patients from the DCVAC arm (c) following stratification by unsupervised hierarchical clustering into low and high inflammatory clusters. (d, e) Direct comparison of PFS of SOC and DCVAC patients following stratification by unsupervised hierarchical clustering into low (d) and high inflammatory clusters (e). (f) PFS of 93 EOC patients upon stratification by the median expression of genes associated with B cell signature, CD3E, immunosuppression, and TH2 signature, and study arm. Survival curves were estimated using the Kaplan–Meier method, and differences between groups were evaluated using the log-rank test. The numbers of patients at risk and p values are reported.
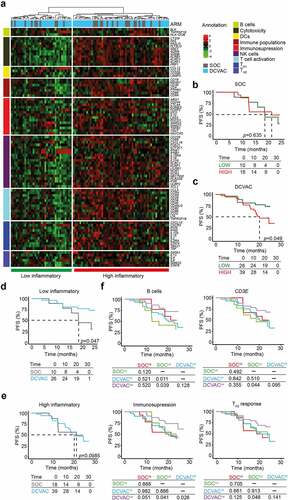
Table 3. Univariate Cox proportional hazard analyses for OS in EOC patients from the SOC and DCVAC arms in SOV01.
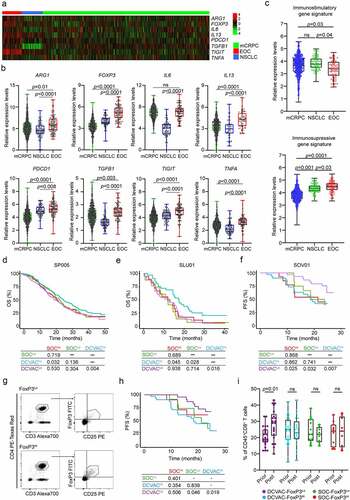
Figure 4. High frequency of regulatory T cells in peripheral blood of EOC patients is associated with poor response to DCVAC therapy. (a) Heat map and (b) relative expression levels of the differentially expressed genes (DEGs) ARG1, FOXP3, IL6, IL13, PDCD1, TGFB1, TIGIT and TNFA in pre-treatment peripheral blood samples among mCRPC, NSCLC, and EOC patients in SP005, SLU01, and SOV01. (c) Relative expression levels of immunostimulatory (CD8A, GNLY, GZMA, GZMB, IFNG, IL12A, PRF1, TBX21) and immunosuppressive (FOXP3, HAVCR2, IDO1, IL10, LAG3, PDCD1, TGFB1, TIGIT) gene signatures in mCRPC, NSCLC and EOC patients in SP005, SLU01, and SOV01. (d, e) OS of 804 mCRPC (d) and 103 NSCLC (e) patients following stratification by the median expression of the immunostimulatory-like gene signature and study arm. (f) PFS of 93 EOC patients following stratification by the median expression of the immunosuppressive-like gene signature and study arm. Survival curves were estimated using the Kaplan–Meier method, and differences between groups were evaluated using the log-rank test. The numbers of patients at risk and p values are reported. (g) Representative dot plots for CD4+CD25+FoxP3+ regulatory T cells in low and high EOC patients in SOV01. (h) PFS of EOC patients treated with SOC or DCVAC stratified by the median percentage of CD4+CD25+FoxP3+ regulatory T cells in peripheral blood. Survival curves were estimated using the Kaplan–Meier method, and differences between groups were evaluated using the log-rank test. (i) Percentage of CD8+ T cells in peripheral blood of SOC FoxP3Lo, SOC FoxP3Hi, DCVAC FoxP3Lo and DCVAC FoxP3Hi patients prior and post DCVAC therapy. Statistical significance was calculated by the Wilcoxon test. p values are indicated.
Supplemental Material
Download MS Word (1.4 MB)Data availability statement
The data generated in this study are available upon request to the corresponding author.