Figures & data
Figure 1. SIC inhibits multiple myeloma induced osteoclastogenesis in vitro and increases myeloma cell apoptosis in co-culture with pre-osteoclasts (a, b) Primary myeloma cells were isolated from bone marrow aspirates of active multiple myeloma (MM) patients using CD138+ magnetic selection. Myeloma cells were co-cultured (CC) with allogeneic CD14+ monocytes (pre-treated with M-CSF and RANKL for 2 days) in the presence or absence of SIC, OpIgG or SpA or with M-CSF only (m only) for 7 days. Cultures were performed in duplicates and cumulative osteoclast numbers from 8 random microscopic fields were determined by TRAP staining (≥ 3 nuclei and positive TRAP staining). (a) Shown are cumulative osteoclast numbers from 7 healthy donors’ monocytes, (one-way ANOVA with Tukey’s posttest). Representative TRAP stainings (b, scale bar: 200 µm) show marked reduction in MM cell induced osteoclastogenesis after SIC treatment. (c, d) CD14+ monocytes were cultured for 16 days with M-CSF and RANKL (M/R) on bone slices in the presence or absence of SIC, OpIgG or SpA or with M-CSF only (m only). Cultures were performed in triplicate, and the erosive potential was determined by lectin staining. (d) Analysis of total erosion area of 4 independent experiments shows significant reduction in osteoclast function after treatment with SIC (one-way ANOVA with Tukey’s posttest). Representative images of lectin staining are shown (c, scale bar: 500 µm). (e-g) Human U266B1 myeloma cells (e) or primary myeloma cells from active MM patients (f) were co-cultured (CC) with CD14+ monocytes (pre-treated with M-CSF and RANKL for 2 days) in the presence or absence of SIC, OpIgG or SpA. Myeloma cells were either analyzed directly (“fresh”), grown alone for 7 or 3 days (“cultured”) or in co-culture with pre-osteoclasts (“CC”). Myeloma cells were removed from the co-culture after 7 (e) or 3 days (f, g) and the percentage of apoptosis (Annexin V & 7AAD double positive in FACS) was analyzed. While co-culture with pre-osteoclasts had a positive effect on myeloma cell survival, the presence of SIC in the co-cultures significantly increased myeloma cell apoptosis (mixed effects analysis). (g) Representative FACS plots of primary MM cell apoptosis shown. *, p < .05; **, p < .01; ***, p < .001.
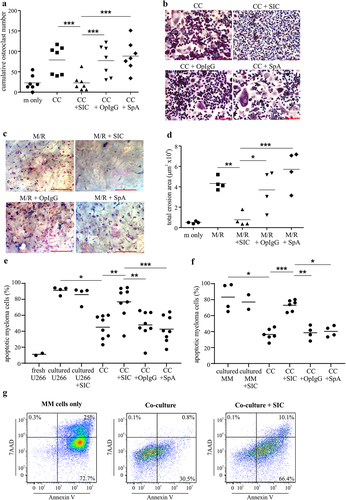
Figure 2. SIC decreases RANK transcript and protein expression and reduces RANKL-induced signaling in pre-osteoclasts. CD14+ monocytes derived from healthy individuals (a, n = 7) or active MM patients (b, n = 4) were cultured with M-CSF overnight, followed by incubation with RANKL for 24 h in the presence or absence of SIC. PCR was performed to assess the level of RANK mRNA, representative endpoint PCR and qPCR analysis (paired t-test) show marked reduction in RANK transcript levels after incubation with SIC. (c) CD14+ monocytes derived from healthy individuals were cultured with M-CSF and RANKL in the presence (red line) or absence of SIC (blue line). Cultures were performed in duplicates and after 2 days cells stained for RANK expression (binding of pacific blue labeled RANK). Levels of RANK protein were significantly reduced after treatment with SIC (paired t-test, n = 6). (d) CD14+ monocytes derived from healthy donors were treated with M-CSF and RANKL for 3 days in the presence or absence of SIC and serum starved for 6 h. After re-incubation with RANKL (100 ng/ml) for 5 or 20 min whole cell lysates were made and probed with antibodies against p38 and phosphorylated p38 MAPK. The percentage of phosphorylation was measured by densitometry and normalized to 0 min of each condition (n = 6). *, p < .05.
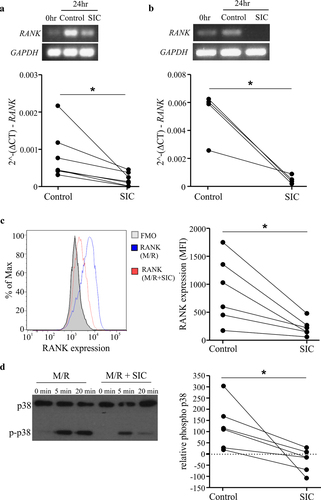
Figure 3. Exposure of monocytes to SIC leads to differential expression of genes implicated in osteoclastogenesis. CD14+ monocytes derived from healthy individuals (n = 3) were cultured with M-CSF overnight, followed by incubation with RANKL for 24 h in the presence or absence of SIC or the appropriate controls (IgG or SpA). Gene expression was determined by performing an Illumina HumanHT-12 V4.0 beadchip Array. The quantile normalized data was analyzed with Partek Genomic Suite. After log2 transformation a paired ANOVA was carried out on transcripts passing a low-expression cutoff filter (<6.1). Principal component analysis (PCA) (a), gene expression heat map (b) of all significant genes (FDR-adjusted p < .05) and gene ontology (GO) enrichment for all up-regulated genes (c, d) was performed with Searchlight. (a) Gene expression PCA shows PC1 (x-axis), PC2 (y-axis) and variance explained by each component; samples are colored by sample group. (b) Gene expression heatmap for the 47 significant genes (FDR adjusted p < .05) between control or IgG or SpA and SIC. Color intensity represents row scaled (z-score) expression level with yellow as high and pink as low. The y-axis has been hierarchically clustered using spearman values and mean agglomeration. SIC treatment results in a distinct expression profile (a, b), whereas IgG or SpA treatment did not induce any significant changes in the transcriptome compared to control cultures. (c) GO enrichment results (hypergeometric) for all up-regulated genes, showing the five most significant ontologies. (d) Gene expression boxplot for all significant genes in the “cytokine-cytokine receptor interaction” gene ontology. Expression levels are given as per gene z-scores. GO analysis for all up-regulated genes showed a significant enrichment for “cytokine-cytokine receptor interaction”. (e) qPCR validation of genes implicated in this pathway confirmed significant up-regulation of Oncostatin M, TNFRSF4, TNFRSF18 and CCL4L1 by SIC. 2^-(DCT) values (n = 7) are shown (paired t-test). (f) CD14+ monocytes were cultured with M-CSF overnight, followed by incubation with RANKL for 24, 48 and 72 h in the presence or absence of SIC. Oncostatin M and CCL24 protein levels in supernatants were determined by ELISA. Data from 4 independent experiments are shown (two-way ANOVA, Sidak’s posttest). *, p < .05; **, p < .01. N.D. = not detectable.
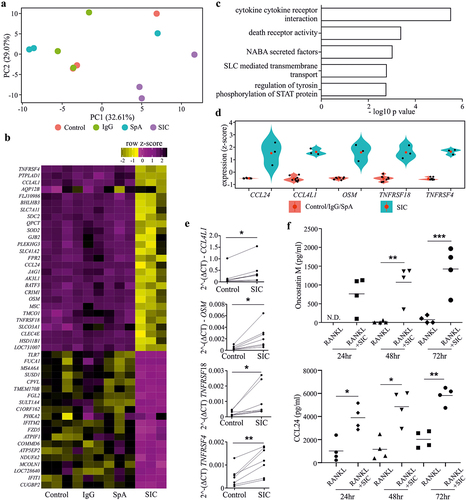
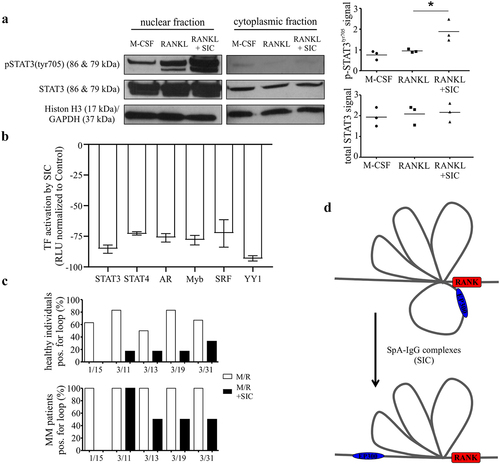
Figure 4. SIC induces a decrease in transcription factor activation and the loss of specific chromosome loops at the RANK gene promoter. (a, b) CD14+ monocytes (n = 3) from healthy individuals were cultured with M-CSF for 24 h followed by exposure to RANKL for a further 24 h in the presence or absence of SIC. Nuclear extracts were created and activation levels of transcription factors assessed by western blotting (a, phosphorylation of STAT3) or by Transcription Factor activation profiling arrays (Signosis, b). (a) Western blot band density was analyzed with ImageJ and densitometry values for phospho-STAT3 were normalized to total STAT3 densities (one-way ANOVA, Tukey’s posttest). (b) Shown is TF activation after SIC treatment for all TFs with a consistently reduced activity for all 3 monocyte sets (fold change < 2). Data is represented as relative light units (RLU) normalized to untreated monocytes (mean ± SEM). (c) CD14+ monocytes from healthy individuals (n = 6) and active MM patients (n = 2) were cultured with M-CSF for 24 h, followed by RANKL treatment for further 24 h in the absence or presence of SIC. Important epigenetic sites within and around the RANK promoter as previously identified by episwitch technology were analyzed by Oxford BioDynamics Ltd (OBD). Loop status analysis as determined by the 3C assay using different RANK primer pairs revealed a complete loss of chromosome looping between RANK primer 1 and 15 after treatment with SIC. (d) Schematic illustration of loss in formation of a specific spatially orientated chromosome loop at RANK promoter with the super enhancer EP300, following exposure to SIC. *, p < .05.