Figures & data
Figure 1. Brief summary of canonical calreticulin (CRT) exposure pathway.
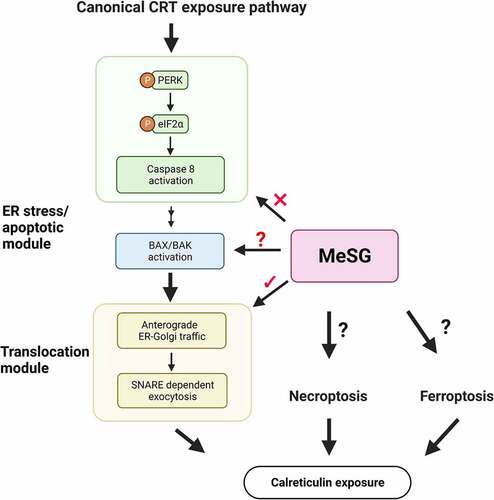
Figure 2. MeSG treatment enhances exposure of calreticulin (CRT) in murine and human melanoma cell line.
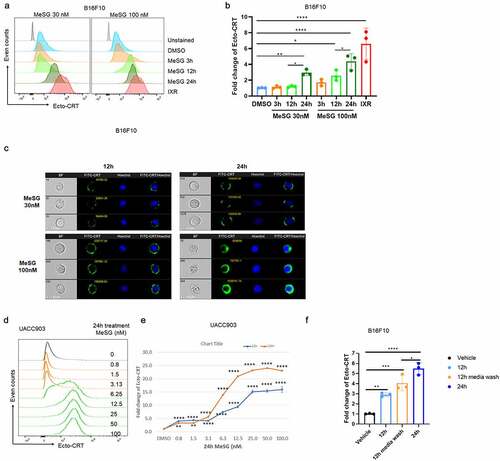
Figure 3. MeSG enhances phagocytosis of B16F10 by murine BMDCs.
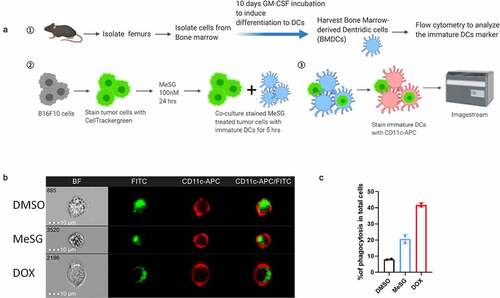
Figure 4. MeSG treatment doesn’t induce exposure of CD47 and ERp57 on surface of B16F10 and UACC903 cells.
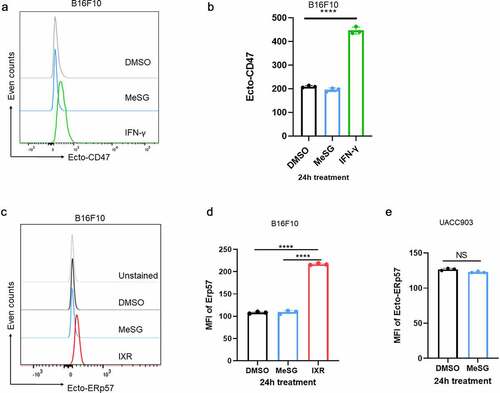
Figure 5. The effects of MeSG on ER stress related-proteins and PERK phosphorylation.
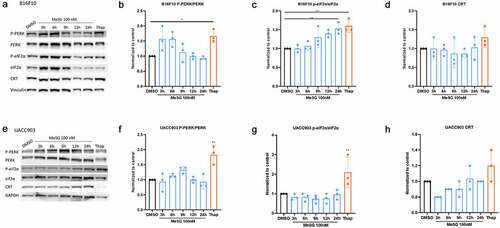
Figure 6. The relationship of MeSG-induced CRT exposure to ER stress and PERK phosphorylation.
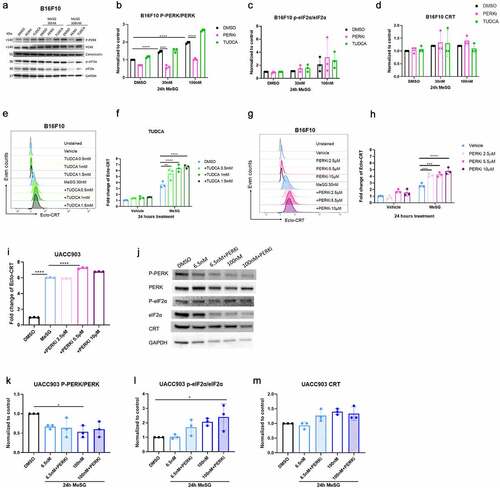
Figure 7. PERK and ERp57 knockdown to explore their role in MeSG induced CRT exposure.
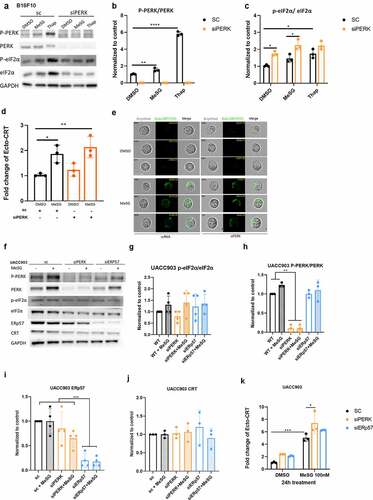
Figure 8. MeSG induce apoptosis in UACC903 cells before CRT exposure.
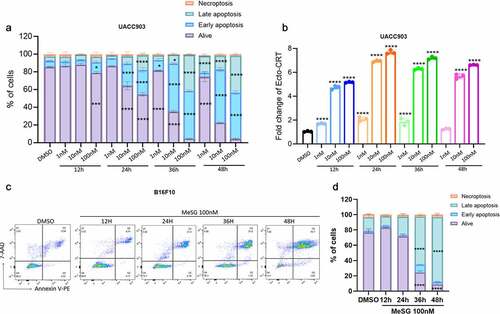
Figure 9. Inhibition of caspase activation can rescue cells from apoptosis induced by MeSG but can not inhibit CRT exposure.
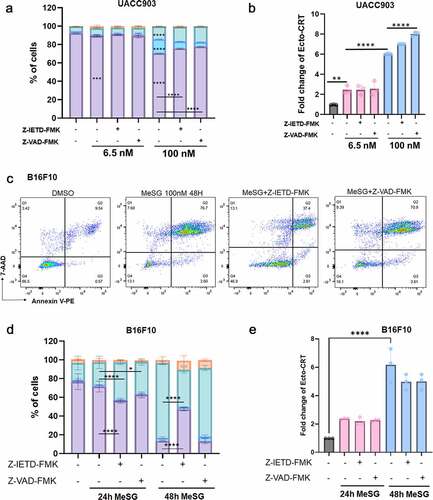
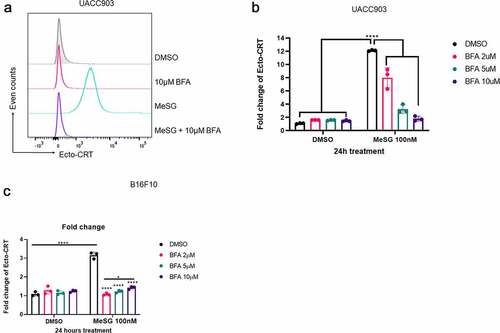
Figure 10. Induction of calreticulin exposure by MeSG can be blocked by Brefeldin A pre-treatment.