
Figures & data
Figure 1. SVX vaccine modulates tumor angiogenesis with a transient decrease in VEGF levels in the tumor.
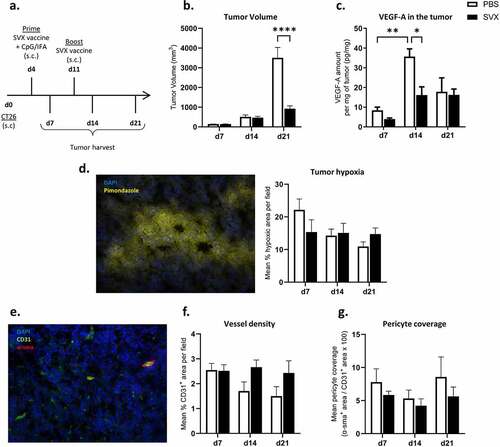
Figure 2. Strong therapeutic efficacy of the combination when the vaccination is initiated at the end of sunitinib treatment.
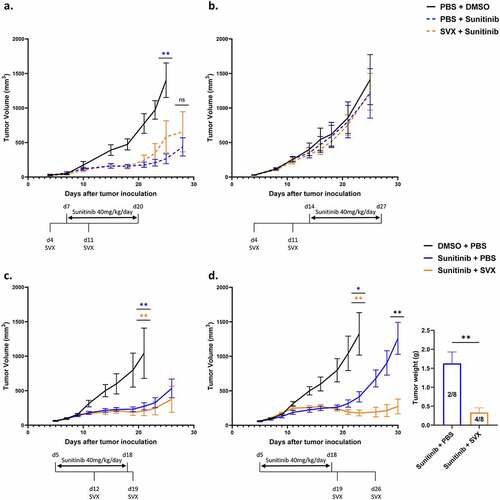
Figure 3. Pericyte coverage and CD8+ T cell infiltration increase one week after the interruption of sunitinib.
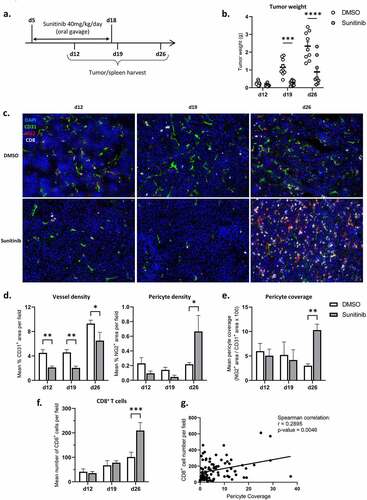
Figure 4. Sunitinib decreases myeloid populations in the spleen over time but transiently increases PMN-MDSCs infiltrating the tumor. In the same experimental settings as described before, CT26-bearing mice were treated or not with sunitinib (d5 to d18). Tumors and spleens were harvested at d12, d19 or d26 to perform phenotyping analysis by flow cytometry (n = 14–18 mice/group/day).
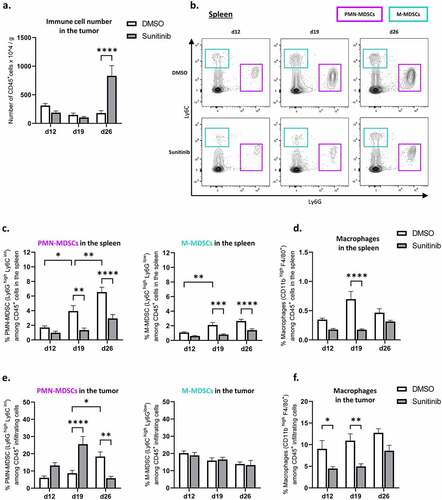
Figure 5. NK populations are decreased during sunitinib treatment and increased after the cessation of treatment in both tumor and spleen.
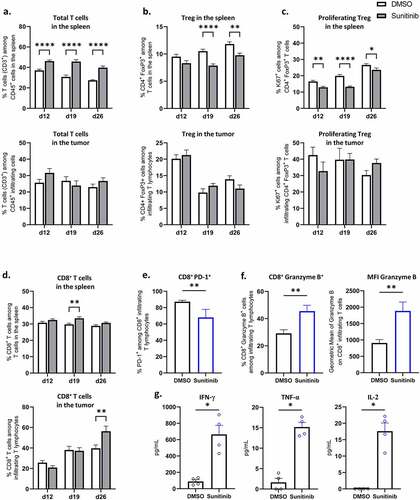
Figure 6. Sunitinib treatment decreases Treg in the spleen and strongly increases CD8+ T cells population and function in the tumor.
Supplemental Material
Download PDF (1.3 MB)Data Availability Statement
The data that support the findings of this study are available from the corresponding author, CT, upon reasonable request.