
Figures & data
Figure 1. Generation of an oncolytic adenovirus expressing murine CXCL10. (a) Schematic diagram of oncolytic adenovirus construction. Adv-Ctrl, control recombinant adenovirus; Adv-CXCL10, recombinant adenovirus encoding murine CXCL10. (b) Fluorescent images of 293 T cells after 24-hour infection with Adv-Ctrl or Adv-CXCL10. Scale bar, 100 μm. (c-d) MC38-CAR cells were infected with recombinant adenovirus at an MOI of 10 and harvested at the indicated time points. (c) Viral DNA was extracted, and the viral copy number was quantified by quantitative PCR. The figure represents one of three replicative experiments. (d) Viral replication capacity determined by titer test using TCID50 method. The figure represents one of three replicative experiments. (e) CXCL10 concentration in different cell supernatants. MC38-CAR cells were infected with adenovirus at different MOIs. The supernatants were collected 48 hours after virus infection. Three replicates were performed for each sample. (mean ± SD; * P < .05; ** P < .01; ns, not significant)
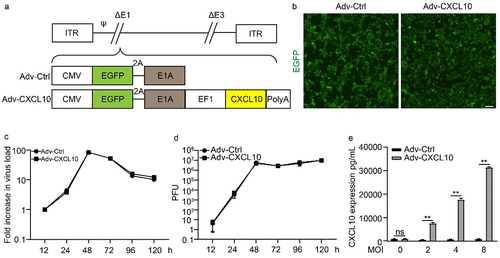
Figure 2. Adv-CXCL10 not only kills tumor cells but also recruits lymphocytes in vitro. (a) MC38-CAR cells were plated into 96-well plates and infected with Advs at the corresponding MOIs for 48, 72 and 96 hours. The oncolytic ability was tested by crystal violet staining. (b) MC38-CAR cells were incubated in 96-well plates and infected with Advs at different MOIs for 48 hours. The cell survival rate relative to control was calculated by the CCK-8 assay. (c&d) Chemotaxis assay of murine primary lymphocytes. (c) Microscope images of lymphocytes migrating to the lower well attracted by different conditional media in the lower chambers. Scale bar, 200 μm. (d) Counts of lymphocytes recruited into the lower chambers by the medium. (The data all showed one of three independent experiments. mean ± SD; * P < .05; ** P < .01; ns, not significant)
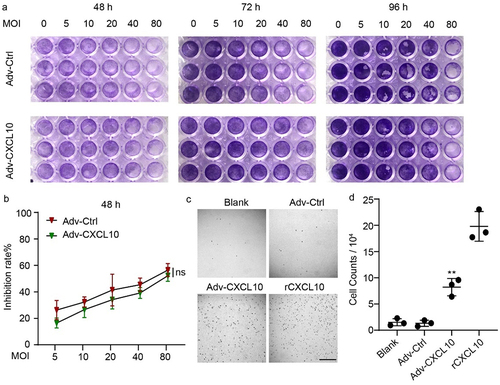
Figure 3. Adv-CXCL10 promotes T cell infiltration in MC38-CAR allograft tumors in vivo. (a) Brief process of MC38-CAR allograft model construction. Samples were collected on Day 11. (b) Tumor volume changes assessed every 2 days once the treatment began. (c&d) TUNEL staining (c) and quantification (assessed by 3 random areas in (c)) of TUNEL-positive areas in tumor tissues. Scale bar, 100 μm. (e&f) Images of PCNA-positive cells (e) and quantification of PCNA-positive areas (f). Scale bar, 100 μm. (g) Expression of CD4 and CD8 in the tumor tissues of each group was tested by IF. Scale bar, 100 μm. (h&i) Quantitative analysis of CD4 and CD8 positive areas in (g). Three random fields of view per mouse of different groups were calculated. (j&k) Cytometric analysis of CXCR3+ T cells in the TILs of each group. (j) Representative image of 3 replications in each group. (k) Statistical analysis of CXCR3+ T cells in different groups. n = 3. (l) CXCL10 expression in mouse peripheral blood serum and tumor tissues, assessed by ELISA. n = 6. (m-n) IFN-γ ELISpot assay. CD8+ TILs from adenovirus monotherapy MC38-CAR allograft model and MC38 or CT26 were cocultured for 36 h at a 10:1 E/T ratio before harvest. (m) Picture shows the representative image of 3 replications in each group. (n) IFN-γ spots number of different intervention groups in (m). (The data are shown as mean ± SD. * P < .05; ** P < .01; ns, not significant)
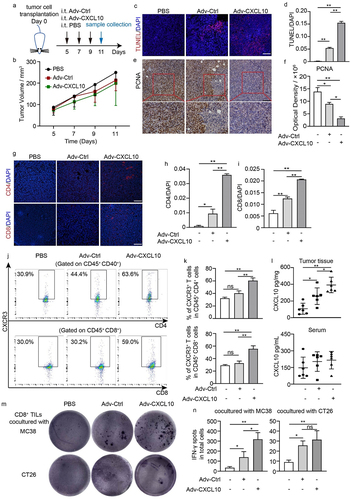
Figure 4. Adv-CXCL10 strongly improves the efficiency of anti-PD-1 therapy. (a) Schematic diagram of the experimental setup for the combination therapy of recombinant adenovirus and PD-1 antibody in MC38-CAR allograft model. Samples were collected on Day 19. (b) Tumor volume changes assessed every 2 days once the treatment began. (c) Analysis of solid tumor weight in 6 different intervention groups. (d) Photos of solid tumors taken after the sacrifice of mice in six groups. (e) Survival curves of mice in different intervention groups. n = 8 for every group. (f) H&E staining of tumor tissues. Scale bar, 100 μm. (g) Apoptosis analysis of tumor tissues assessed by TUNEL staining. Scale bar, 100 μm. (h) Proliferation assay analyzed by PCNA IHC staining. Scale bar, 100 μm. (i&j) Quantification of TUNEL staining and PCNA staining in three different areas in (g) and (h). (n = 6 mice per group in a-d, f-j. The data are shown as mean ± SD. * P < .05; ** P < .01 ns, not significant.)
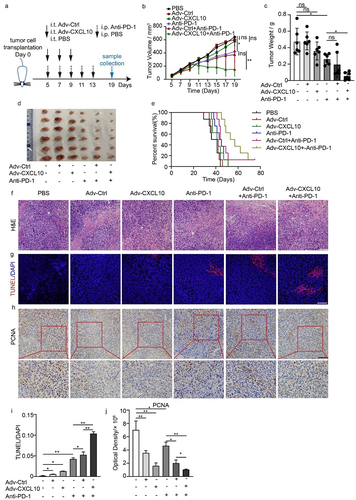
Figure 5. Adv-CXCL10 enhanced anti-PD-1 therapy by recruiting more CXCR3+ T cell into TME. Samples were from MC38-CAR allograft model, collected on Day 19. (a&c) Images of CD4 and CD8 positive areas in tumor tissues assessed by IF. Scale bar, 100 μm. (b&d) Quantification of CD4 and CD8-positive areas in (a) and (c). Three random fields of view per mouse of different groups were calculated. (e&g) The percentage of CD4+CXCR3+ T and CD8+CXCR3+ T cells in TILs shown by flow cytometry. Pictures presented typical examples of 3 samples in each group. (f&h) Quantification of CXCR3+ T cell percentages in different intervention groups. (The data are shown as mean ± SD. * P < .05; ** P < .01; ns, not significant)
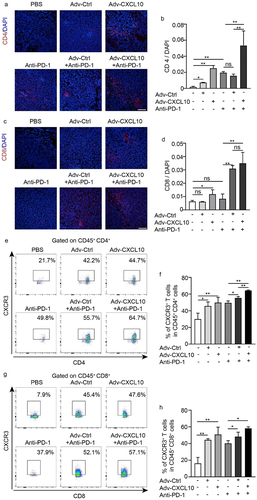
Figure 6. Adv-CXCL10 enhances anti-PD-1 therapy by remodeling an antitumour immune microenvironment. Samples were from MC38-CAR allograft model, collected on Day 19. (a&b) IFN-γ expression in tumor tissues presented by IF (a) and quantification analysis (b). Scale bar, 100 μm. (c&d) mRNA (tested by qPCR) and protein quantification (tested by ELISA) of IFN-γ expression in tumor tissues. (e&f) Granzyme B expression in tumor tissues presented by IF (e) and quantification analysis (f). Scale bar, 100 μm. (g&h) mRNA (tested by qPCR) and protein quantification (tested by ELISA) of granzyme B expression in tumor tissues. (n = 6 mice per group. The data are shown as mean ± SD, * P < .05; ** P < .0001; ns, not significant.)
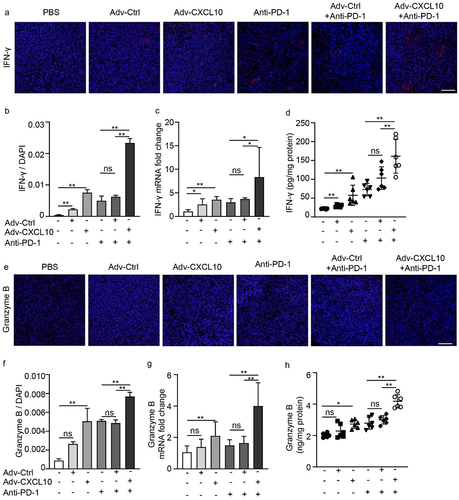
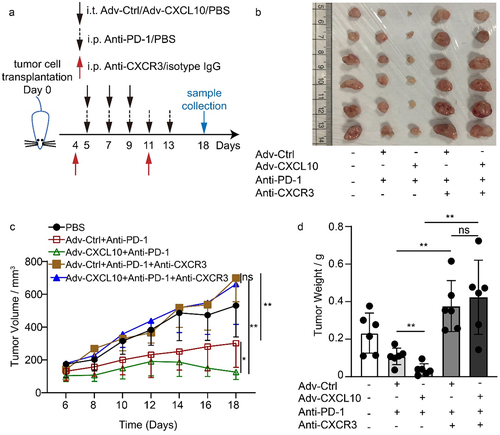
Figure 7. The in vivo Adv-CXCL10 combination effect with PD-1 antibody depends on CXCR3+ cells. (a) Brief introduction of CXCR3 blockade experiments of MC38-CAR allograft model. (b) Photos of solid tumors taken after the sacrifice of mice in separate groups. (c) Tumor volume changes assessed every 2 days once the intervention began. (d) Analysis of solid tumor weight in 5 different intervention groups. (n = 6 mice per group, data are shown as the mean ± SD, * P < .05, ** P < .01, ns, not significant.)
Supplemental Material
Download MS Word (2.7 MB)Data availability statement
We confirm we understand the terms of the share upon reasonable request data policy and we will make the data freely available upon request.