
Figures & data
Table 1. Patient characteristics.
Figure 1. Patient treatment timeline. Schematic overview of events (blood sample collection, RFA/TACE, LTx, HCC-specific death) in HCC patients included in the study during the follow-up period. The colors indicate the presence or absence of detectable HCC tumor. Patient ITV-016 was retreated with RFA 13 weeks after the first treatment due to rapid recurrence. Of this patient, blood samples were collected before and after the first RFA and before and after the second RFA and were included in the study separately.
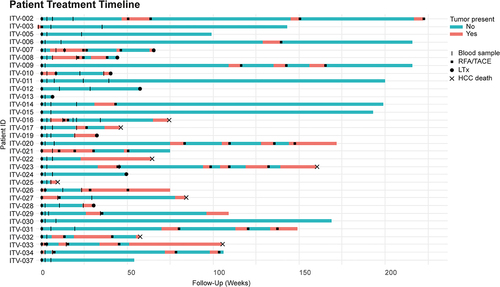
Figure 2. HCC patients show enhanced frequencies of circulating CTA-specific CD8+ T-cells compared to healthy subjects. PBMC from HCC patients before (t = 0), and approximately 3, 7, and 25 weeks (see for the exact time points) after RFA/TACE treatment were phenotyped by flow cytometry (n = 26). CTA-specific CD8+ T-cells were determined in HLA-A*02:01-positive patients (n = 17) using CTA peptide-loaded HLA-A*02:01 dextramers. Patient ITV-016 was included twice, before and after a first RFA and before and after a second RFA treatment. A. CTA-specific CD8+ T-cells were detected using a pool of 7 CTA peptide-loaded HLA-A*02:01 dextramers (Supplementary Table S3). Frequencies of CMVpp65495-503-specific CD8+ T-cells were measured for comparison. B. Differentiation status of CMVpp65495-503-dex+, CTA-dex+ and CTA-dex− CD8+ T-cells was determined based on CD45RA and CCR7 expression (Naïve; CD45RA+CCR7+, central memory [CM]; CD45RA−CCR7+, effector memory [EM]; CD45RA−CCR7−, and TEMRA; CD45RA+CCR7−). C. CMV-specific CD8+ T-cells were detected in healthy blood bank donors, but only a maximum of 0.06% of CD8+ T-cells recognized the pooled CTA-peptides. D. Surface expression of activation marker CD137, intracellular expression of proliferation marker Ki67, cytotoxic effector molecule granzyme B and checkpoint inhibitor PD1 were determined in CTA-dex+, CMV-dex+ and CTA-dex− CD8+ T-cells. Wilcoxon signed-rank test, * p < .05, **p < .01, ***p < .001.
![Figure 2. HCC patients show enhanced frequencies of circulating CTA-specific CD8+ T-cells compared to healthy subjects. PBMC from HCC patients before (t = 0), and approximately 3, 7, and 25 weeks (see Figure 1 for the exact time points) after RFA/TACE treatment were phenotyped by flow cytometry (n = 26). CTA-specific CD8+ T-cells were determined in HLA-A*02:01-positive patients (n = 17) using CTA peptide-loaded HLA-A*02:01 dextramers. Patient ITV-016 was included twice, before and after a first RFA and before and after a second RFA treatment. A. CTA-specific CD8+ T-cells were detected using a pool of 7 CTA peptide-loaded HLA-A*02:01 dextramers (Supplementary Table S3). Frequencies of CMVpp65495-503-specific CD8+ T-cells were measured for comparison. B. Differentiation status of CMVpp65495-503-dex+, CTA-dex+ and CTA-dex− CD8+ T-cells was determined based on CD45RA and CCR7 expression (Naïve; CD45RA+CCR7+, central memory [CM]; CD45RA−CCR7+, effector memory [EM]; CD45RA−CCR7−, and TEMRA; CD45RA+CCR7−). C. CMV-specific CD8+ T-cells were detected in healthy blood bank donors, but only a maximum of 0.06% of CD8+ T-cells recognized the pooled CTA-peptides. D. Surface expression of activation marker CD137, intracellular expression of proliferation marker Ki67, cytotoxic effector molecule granzyme B and checkpoint inhibitor PD1 were determined in CTA-dex+, CMV-dex+ and CTA-dex− CD8+ T-cells. Wilcoxon signed-rank test, * p < .05, **p < .01, ***p < .001.](/cms/asset/1097b588-a1f2-44b0-a22b-f7244a22e1e6/koni_a_2131096_f0002_oc.jpg)
Figure 3. CTA-specific stimulation induces proliferative responses in CD4+ and CD8+ T-cells of HCC patients. CTA-specific CD4+ and CD8+ T-cell proliferation was measured in 16 HCC patients by 6-day stimulation of CFSE-labeled PBMC with CTA mRNA or luciferase mRNA (negative control)-electroporated autologous B-cell blasts. CTA-specific proliferation was then calculated by dividing the percentage proliferated (CFSE-low) T-cells upon CTA-stimulation by the percentage proliferated T-cells upon luciferase-stimulation. A. Gating example of proliferation of CD4+ and CD8+ T-cells collected before (t = 0) and t = 3 and t = 45 weeks after RFA from patient ITV-023 upon 6 days of stimulation with MAGEA9 or luciferase mRNA electroporated B-cell blasts. B. Heat map indicates fold-changes in proliferation of peripheral CD4+ and CD8+ T-cells upon stimulation with individual CTAs compared to stimulation with luciferase (colored legend). CTA-specific T-cell responses were considered positive with a ≥ two-fold increase compared to lucifase-stimulated T-cell proliferation was observed. For comparison, proliferative responses against the onco-fetal tumor-associated antigen GPC3 were measured in 11 patients and depicted as fold changes compared to stimulation with eGFP. Patient ITV-016 was included after initial RFA and after a second RFA 13 weeks after the first treatment due to rapid cancer recurrence. Annotation above the heat map indicates the etiology of HCC, AFP levels before treatment, and the treatment (RFA or TACE) which the patients received. Annotation below the heat map indicates the actual weeks after treatment at which blood samples of the individual patients were collected (t = 0: before local tumor ablation).
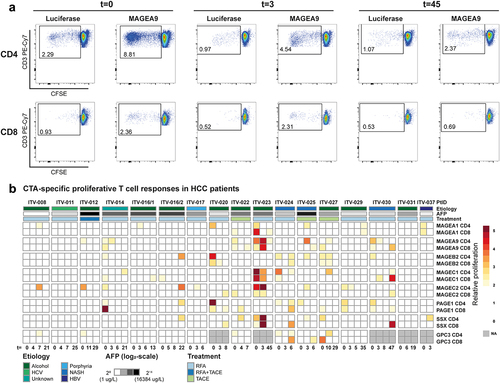
Figure 4. CTA-specific peptide stimulation induces cytokine and granzyme B production in PBMC of HCC patients. Peptide-specific induction of cytokine and granzyme B (GrB) production was measured after re-stimulation of expanded PBMC of 8 HCC patients prior to local ablative treatment (t = 0) and at the indicated weeks after intervention. A. Heatmaps depicting the fold changes for production of the indicated cytokines and GrB in the peptide stimulated condition compared to the solvent-containing medium condition. Peptides with a ≥ 2 fold change were determined to have evoked a peptide-specific response and are depicted as such (color-coded legend). B. Heatmap displaying concomitant production of GrB, IL-2 and/or TNF-α in the combinations indicated by the color-coded legend. Annotation above the heat map indicates the etiology of HCC, AFP levels before treatment, the treatment (RFA or TACE) patients received, and HBV status. Underlined peptides were included in our study based on in silico prediction of HLA-binding properties.
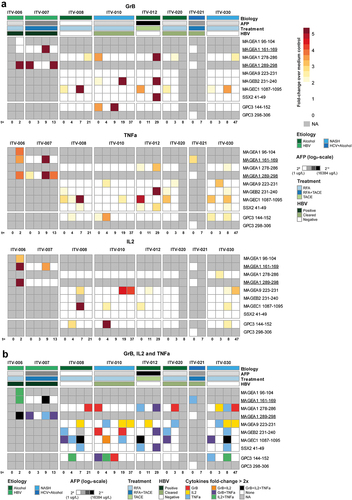
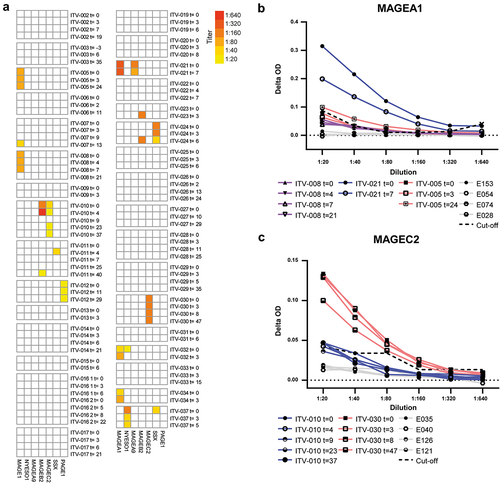
Figure 5. HCC-patients mount CTA-specific IgG responses. CTA-specific IgG responses were measured in 32 HCC patients by indirect ELISA. ELISA plates were coated with human recombinant full length CTA protein, and after incubation with HCC patients’ plasma, CTA-specific IgG was detected by anti-human IgG-HRP. After screening of 1:20 plasma dilutions, the positive samples were titrated. A. Heat map displaying the CTA-specific IgG responses in individual before and at different time points (weeks) after local tumor ablation. Columns show IgG titers against the 7 different CTAs. Colors indicate the detected titers (legend). B, C. Examples of serial dilutions of plasma samples of 3 HCC-patients in MAGEA1 ELISA (b) and of 2 patients in MAGEC2 ELISA (c). The delta optical density (ΔOD) of each plasma sample was calculated by subtracting the sample’s OD in wells coated with BSA from the OD in wells coated with the specific CTA protein. In each ELISA, plasma samples of 4 healthy individuals (indicated by E numbers) were included as negative controls to determine the cutoff OD-value that was used to determine positivity of patient samples. The dotted line indicates the cutoff for each dilution, which was determined by the average plus 10 times the standard deviation of the OD-values of 4 healthy control samples.
Supplemental Material
Download Zip (2.5 MB)Data availability statement
All data generated or analyzed during this study are included in this article or its supplementary material files. Further enquiries can be directed to the corresponding author.