
Figures & data
Table 1. Clinical characteristics and frequency of cytogenetic determinants of patients (n = 71). Cytogenetic analysis included karyotype, t(11;14), t(4;14), t(14;16), gain 1q, p53 alterations and IGH-FGFR3/IGH-MAF gene fusions. NA, not analyzed.
Figure 1. Analysis of CRT exposure in patients with plasma cell dyscrasias. (a) Ecto-CRT levels were determined in CD38+ BMMCs isolated from clinically diagnosed patients with varying degrees of MM disease (MGUS, SMM, MM). Control BM (HD) was obtained from individuals with other pathologies that held an uncompromised BM evidenced by histological or flow cytometry examination. Statistical analysis was performed using one-way ANOVA test with Tukey post test, where *p < .05, **p < .01, ***p < .001, ns, non-significant. (b) Time to progression (TTP) was compared between CRThigh and CRTlow subgroups. Data are shown as median with interquartile range. Statistical analysis was performed using unpaired t test with Welch’s correction (*p < .05). (c) The expression of ecto-CRT in patients showing or not extramedullary plasmacytomas was analyzed. Statistical analysis was performed using Fisher’s exact test, where *p < .05, **p < .01, ***p < .001, ns, non-significant. (d) Kaplan–Meier curve comparing the survival of patients in the CRThigh and CRTlow groups. Overall survival of patients with overt MM was calculated from the time of sample retrieval and CRT analysis. HR was obtained by the univariate log-rank (Mantel-Cox) test. (e) Multivariate Cox regression analysis of the indicated variables. (f) Patients were stratified in two groups (treated and untreated) depending on whether they have previously received any chemotherapeutic regimen or not at the moment when BM sample was collected. Ecto-CRT levels were compared between these two groups. Statistical analysis was performed using two-way t test, where *p < .05, **p < .01, ***p < .001, ns, non-significant. (g) Samples were stratified in two groups based on their median ecto-CRT levels and number of total lines of therapy patients received was compared between CRThigh and CRTlow subgroups. Statistical analysis was performed using Chi-square test for trend (*p < .05, **p < .01, ***p < .001) Left: global analysis; Right: samples from overt MM patients. (h) Individuals with MM or MGUS/SMM diagnosis were stratified depending on their cytogenetic profile and ecto-CRT levels were compared between these two groups. Bars indicated median with interquartile range. Statistical analysis was performed using Mann-Whitney test. (i) Relationship between CRT exposure and the presence of different cytogenetic abnormalities with varying degrees of risk. Statistical analysis was performed by comparing each of the different groups harboring cytogenetic abnormalities with the normal group, using Kruskal-Wallis test where *p < .05.
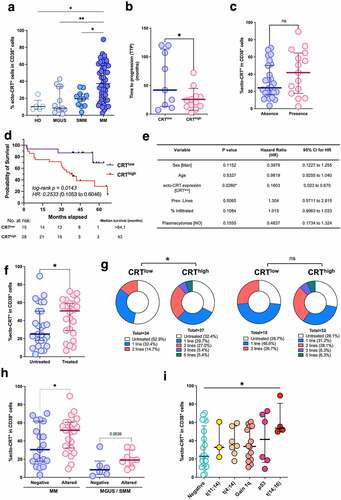
Figure 2. CRT exposure and the BM immune landscape in MM. Patients were stratified in two different cohorts based on their median ecto-CRT levels. Individuals with an equal or inferior value to the median CRT exposure cutoff of the entire population were deemed CRTlow, while individuals with an ecto-CRT expression level over the median cutoff were classified under CRThigh group. (a) BM frequencies of CD4+CD3+ T cells, CD8+CD3+ T cells, CD3+ T lymphocytes, as well as the percentage of CD4+ and CD8+ T cells within CD3+ population and the corresponding CD4+/CD8+ ratios were analyzed by flow cytometry. (b) The percentage of CD56+CD45+ NK cells in BM was determined by flow cytometry in the CRThigh and CRTlow groups. (c) Plasmacytoid lineage-negative/HLA-DR+/CD123+ DCs (pDCs) and myeloid lineage-negative/HLA-DR+/CD11c+ DCs (mDCs) subpopulations were also analyzed. Lineage-negative cells (Lin-) were determined by staining with FITC-conjugated antibodies against the following markers: CD3, CD14, CD16, CD19, CD20 and CD56. Statistical analysis was performed using two-way t test (*p < .05, **p < .01, ***p < .001). Data plotted in the figure represent the frequency of each cell type in individual samples. The mean and SD values in each patient cohort are also illustrated.
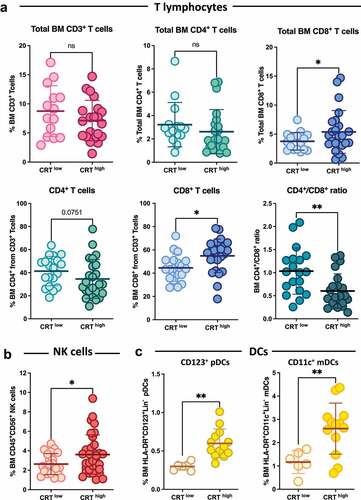
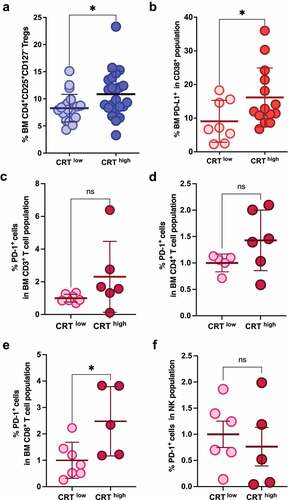
Figure 3. CRT exposure and immunosuppressive markers in MM. Patients were stratified in two different cohorts based on their median ecto-CRT levels. (a) The BM frequencies of Tregs were analyzed in CRThigh and CRTlow samples. (b) PD-L1 expression in CD38+ BM cells was analyzed and compared between CRThigh and CRTlow groups. (c-f) PD-1 expression was analyzed in the indicated immune subpopulations and compared in patient’s subgroups based on their ecto-CRT expression levels. Statistical analysis was performed using two-tail t test (*p < .05, **p < .01, ***p < .001). Data plotted in the figure represent the frequency of each cell type in individual samples. Global mean and SD in each cohort are also illustrated.
Supplemental Material
Download MS Word (11.1 MB)Data availability statement
The data that support the findings of this study are available from the corresponding author, IM, upon reasonable request.