Figures & data
Figure 1. CD38 and CD20 levels on primary effusion lymphoma (PEL) cells. (a and b) The levels of surface CD38 and CD20 expression on PEL cells (red), B cells (blue) and plasma cells (green) from effusions (6 pleural fluid and 2 peritoneal fluid) of eight PEL patients were measured by flow cytometry and expressed as median fluorescence intensity (MFI). None of these patients were treated with Dara. The PEL cells were gated by a combination of previously validated light scatter property and antigen expression patternsCitation26,Citation27 and without utilizing either CD20 or CD38 gating. One sample did not have detectable B cells while 3 had no detectable plasma cells. (c) Levels of CD38 on the surface of a Burkitt’s lymphoma (BL) cell line, Daudi, and PEL cell lines, BCBL-1, BC-1, BC-3, JSC-1, and BC-2, were measured by flow cytometry using PerCP-Cy5.5 conjugated isotype control or anti-CD38 antibody.
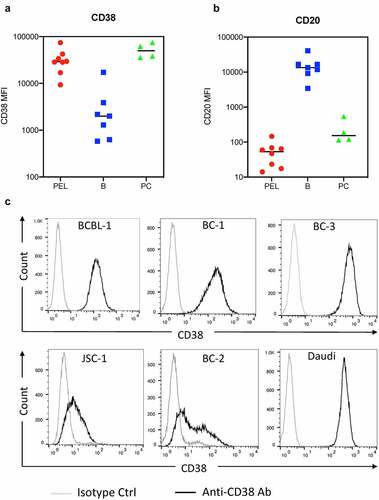
Figure 2. Binding of Dara to surface CD38 on PEL cell lines. Binding of various concentrations of Dara to CD38 on the surface of PEL cell lines was measured by flow cytometry. Shown are high-CD38 lines BCBL-1, BC-3, and BC-1 cells (a) and low-CD38 lines BC-2 and JSC-1 (b) stained with various concentrations of Dara or human IgG1 isotype control and then stained with FITC-conjugated anti-human IgG 2° Ab. Data are expressed as fold change in median fluorescence intensity (MFI) from Ab-treated cells over background MFI from untreated cells and shows average and standard deviations from 3 separate experiments in (a) and 2 separate experiments in (b).
Figure 3. Lack of Dara-mediated complement-dependent cytotoxicity (CDC) of PEL cell lines. (a) CDC in the presence of 20% pooled normal human serum was performed on Daudi, a BL cell line, and BCBL-1 and BC-3 PEL lines, in the presence or absence of 10 µg/mL Dara. Cells were stained with propidium iodide (PI) and % lysis was determined based on PI-positive cells using flow cytometry after 2 h. (b) Levels of complement-inhibitory proteins CD46, CD55, and CD59 on the surface of Daudi or various PEL cell lines were measured by flow cytometry after staining the cells with PerCP-Cy5.5-conjugated anti-CD46 or anti-CD55 antibodies or FITC-conjugated anti-CD59 antibody. Data are expressed as median fluorescence intensity (MFI). (c and d) BCBL-1 (c) and BC-3 (d) cells were incubated with 10 µg/mL isotype control or neutralizing antibodies against CD59, CD55, or both prior to performing CDC assays with or without 10 µg/mL Dara as described in (a). Data are presented as % lysis as determined by PI-positive cells using flow cytometry. Error bars represent standard deviations from at least 3 independent experiments. Statistically significant differences (*P ≤ .05, **P ≤ .01) by 2-tailed t-test are indicated.
Figure 4. Dara-induced ADCC of PEL cell lines. (a) ADCC induction by Dara was assessed using Jurkat-ADCC cells (expressing FcY receptor and luciferase-driven NFAT response element) as the effector cells. BCBL-1, BC-1, or BC-3 cells were treated with various concentrations of Dara or human IgG isotype control ab and co-incubated with Jurkat-ADCC cells; luciferase activity was measured after 6 h. Data are presented as relative luminescence unit (RLU) from Jurkat-ADCC cells alone or Jurkat-ADCC cells co-incubated with PEL cells in the presence or absence of Dara from one representative experiment. (b) ADCC pathway activation in Jurkat-ADCC cells by 0.6 ug/mL Dara-treated PEL cell lines presented as fold change in luciferase activity over control-treated cells. Data represent an average from 3 independent experiments (4 experiments for BC-3) and error bars represent standard deviations. (c) PBMC-mediated ADCC of BCBL-1 and BC-3 cells as measured by calcein-AM release assay. Percent specific lysis was calculated by subtracting the % lysis in the absence of Dara from that in its presence. Data represent an average of 4 (BCBL-1) or 3 (BC-3) separate experiments and error bars represent standard deviations. Statistically significant differences (*P ≤ .05, **P ≤ .01, ***P ≤ .001) relative to controls without Dara as calculated using 2-tailed t-test are indicated.
Figure 5. Rituximab does not induce complement-dependent cytotoxicity (CDC) or antibody-dependent cell-mediated cytotoxicity (ADCC) against PEL cell lines. (a) Levels of CD20 on the surface of a BL cell line, Daudi, and PEL cell lines, BCBL-1, BC-1, and BC-3, were measured by flow cytometry using PerCP-Cy5.5 conjugated isotype control or anti-CD20 antibody. (b) Complement dependent cytotoxicity (CDC) in the presence of 20% pooled normal human serum was performed on Daudi and PEL cell lines treated with 10 µg/mL rituximab or control ab. Cells were stained with propidium iodide (PI) and % lysis was determined based on PI-positive cells using flow cytometry. (c) ADCC induction by rituximab (RTX) assessed using Jurkat-ADCC cells as the effector cells. Daudi or PEL cell lines were treated with various concentrations of rituximab and co-incubated with Jurkat-ADCC cells and luciferase activity was measured after 6 h. Data are presented as fold change in luciferase activity in the presence of rituximab over that in its absence. Error bars represent standard deviations from 3 independent experiments. Statistically significant differences (*P ≤ .05, **P ≤ .01) by 2-tailed t-test are indicated.
Figure 6. All-trans retinoic acid (ATRA) increases CD38 expression of PEL cell lines and enhances Dara-mediated ADCC induction. (a) Levels of surface CD38 on PEL cell lines treated with DMSO alone (0 nM ATRA) or with 10 nM ATRA for 72 h were measured by flow cytometry using PerCP-Cy5.5 conjugated anti-CD38 antibody and expressed as median fluorescence intensity (MFI) after subtracting background MFI from isotype control ab. Results represent average MFIs and standard deviations from at least 3 separate experiments. (b and c) ADCC pathway activation by DMSO or 10 nM ATRA-treated BC-2 (b) and JSC-1 (c) cells after co-incubation with Jurkat-ADCC cells for 6 h in the presence of various concentrations of Dara. Data show one representative experiment from 3 separate experiments and is expressed as relative luminescence unit (RLU) from Jurkat-ADCC cells alone or co-incubated with the PEL lines. (d) Change in ADCC by ATRA-treated BC-2 and JSC-1 cells over that by DMSO-treated cells is presented as fold change in RLU from Jurkat-ADCC cells after 6 h co-incubation in the presence of 0.6 µg/mL DARA or isotype control ab. Data show averages and standard deviations from 4 separate experiments. Statistically significant differences (*P ≤ .05, **P ≤ .01) by 2-tailed t-test are indicated.
Figure 7. Pomalidomide increases CD38 expression of PEL cell lines and enhances Dara-mediated ADCC. (a) PEL cell lines were treated for 72 h with DMSO control (0 Pom) or indicated concentrations of Pom and then the live cell number was counted after trypan blue-staining. Live cell number in Pom-treated cells as a percentage of DMSO-treated cells are presented. (b) Levels of surface CD38 on PEL cell lines treated with DMSO or Pom for 72 h were measured by flow cytometry using PerCP-Cy5.5 conjugated anti-CD38 antibody and expressed as median fluorescence intensity (MFI) after subtracting background MFI from isotype control ab. Results represent average MFIs and standard deviations from at least 3 separate experiments. Because of toxicity at higher concentrations, the highest concentration of Pom utilized in JSC-1 cells was 1 µM. (c) ADCC pathway activation by DMSO or Pom-treated PEL cells (BC-2 with 1 µM and JSC-1 with 0.5 µM Pom) after co-incubation with Jurkat-ADCC cells for 6 h in the presence of various concentrations of Dara. Data show one representative experiment from three separate experiments and is expressed as relative luminescence unit (RLU) from Jurkat-ADCC cells alone or co-incubated with the PEL lines. (d) Change in ADCC-induction by Pom-treated BC-2 and JSC-1 cells over that by DMSO-treated cells is presented as fold change in RLU from Jurkat-ADCC cells after 6 h co-incubation in the presence of 0.6 µg/mL Dara or isotype control ab. Data show averages and standard deviations from 4 separate experiments. Statistically significant differences (*P ≤ .05, **P ≤ .01) by 2-tailed t-test are indicated.