
Figures & data
Figure 1. Molecular diagrams and models of the IgTT-E and IgTT-1E antibodies. Gene layout of the monospecific IgTT-E (a), bearing a signal peptide from oncostatin M (white box), three anti-EGFR VHH (green boxes), three collagen-derived trimerization (TIE) domains (yellow boxes) flanked by peptide linkers and the Fc encoding element (gray boxes). N-terminal FLAG-Strep and C-terminal Myc-His tags (blue boxes) were appended for purification and immunodetection purposes. Schematic diagram showing the three-dimensional model of the TT (b), the molecular diagram and the three-dimensional modelizations of the IgTT-E, in front and top views (c). Gene layout of the bispecific IgTT-1E (d), bearing a signal peptide from oncostatin M (white box), one anti-PD-L1 scFv (red box) and two anti-EGFR VHH genes (green boxes), three TIE domains (yellow boxes) flanked by peptide linkers and the Fc encoding element (gray boxes). N-terminal FLAG-Strep and C-terminal Myc-His tags (blue boxes). Schematic diagram showing the three-dimensional model of the TT (e), the molecular diagram and the three-dimensional modelizations of the IgTT-1E in front and top views (f).
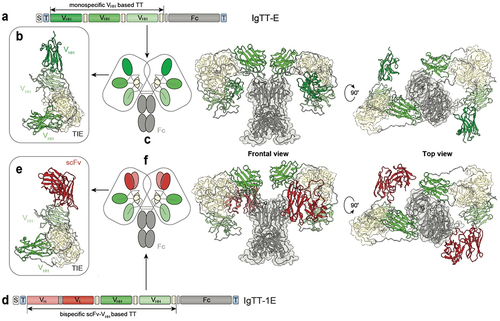
Figure 2. Binding characteristics of mono- and bispecific IgTT antibodies to EGFR, PD-L1, and both antigens simultaneously. (a) BLI-derived sensorgrams (in black) for the interaction between cetuximab (ctx) or IgTT-E and immobilized human EGFR-Fc. (b) Human EGFR-Fc was immobilized onto biosensors and 10 nM of either the IgTT-1E (black trace) or ctx (blue trace) was associated for 30 minutes, followed by 30 minutes of dissociation in buffer only. (c) as in the previous panel, binding to immobilized human PD-L1-Fc was investigated using atezolizumab (atz, blue trace) as a comparison antibody. The results of fitting to a 1:1 binding model are shown as red traces. Kinetic rate parameters from fitting are given in Table S3. A single experimental sensorgram of each antibody is shown; duplicate biosensors were included in the experiment and showed negligible variation. (d) Simultaneous binding to both immobilized human EGFR-Fc and human PD-L1-Fc in solution was demonstrated for IgTT-1E (black trace) but not ctx (blue trace). Human EGFR-Fc-coated biosensors were loaded with either IgTT-1E or ctx (as in the panel b), after which biosensors were immersed in 20 nM of human PD-L1-Fc or kept in buffer (red trace). (e) the binding to human EGFR and PD-L1 on the cell surface of CHO, CHOEGFR, CHOPD-L1 and CHOEGFR-PD−L1 cells by trastuzumab (tra), ctx, atz, IgTT-E and IgTT-1E at 6.67 nM was measured by FACS. Cells incubated with PE-conjugated isotype control mAb are shown as gray-filled histogram. The y-axis shows the relative cell number, and the x-axis represents the intensity of fluorescence expressed on a logarithmic scale.
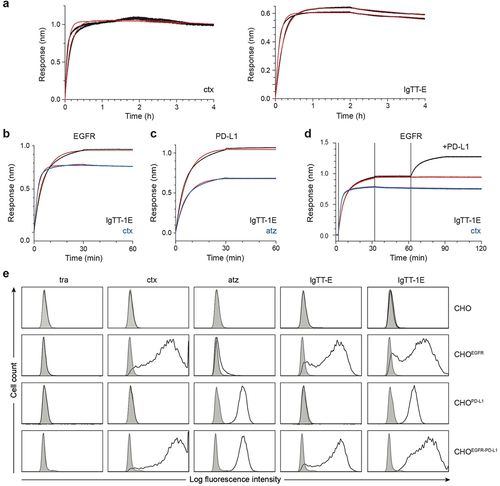
Figure 3. IgTT-1E reduces cell proliferation and induces cytotoxicity. (a) Inhibition of A431 cell proliferation through blocking of EGF/EGFR signaling. The cells were treated with the indicated doses of IgTT-E, IgTT-1E, ctx (positive control) or atz (negative control). Viable cells after 72 hours of treatment were plotted relative to untreated controls. Results are expressed as a mean ± SD (n = 3). Significance was measured by one-way ANOVA with Dunnett’s multiple comparisons test. (b) Inhibition of EGFR phosphorylation was assessed by western blotting. After pre-incubation with 50 nM of each antibody for 4 hours, cells were stimulated for 5 minutes with EGF or vehicle. Using the β-actin as load and signal control, the percentages of each phosphorylation band with respect to the positive control were calculated. (c) PD-1/PD-L1 blockade bioassay assesses the inhibitory activities of PD-L1 blocking antibody IgTT-1E. Y-axis represents reporter gene fold induction. Ctx was used as negative control and atz as positive control. Results are expressed as mean ± SD (n = 3). Significance was measured by one-way ANOVA with Dunnett’s multiple comparisons test. (d) ADCC reporter bioassay response to ctx, atz and IgTT-1E, using ADCC bioassay effector JurkatCD16 cells against CHO and CHOEGFR target cells. Target cells were incubated with ctx (positive control), atz (negative control) and IgTT-1E followed by addition of ADCC bioassay effector cells at a 6:1 E:T ratio. After 6 hours of coincubation at 37°C Bio-Glo™ Luciferase Assay Reagent was added for luminescence determination. Data shown represent the mean ± standard deviation of triplicates. Data are presented as the mean ± SD (n = 3). Quantification shown as mean ± SD, (n = 3). Significance was determined by two-way ANOVA with Tukey’s multiple comparisons test. (e) the number of alive (7AAD−) target A549 and MDA-MB231 cells determined after 48 hour co-culture with PBMC cells at 5:1 and 10:1 E:T ratios in presence of control human IgG, atz, ctx and IgTT-1E. Results are shown as mean ± SD (n = 3). Significance was determined by two-way ANOVA with Dunnett’s multiple comparisons test. (f) Human PBMC were incubated with ctx, atz and IgTT-1E (0.667 nM) for 4 hours prior to flow cytometry evaluation of CD107a cell surface expression on NK cells, gated as CD3−CD56+ cells.
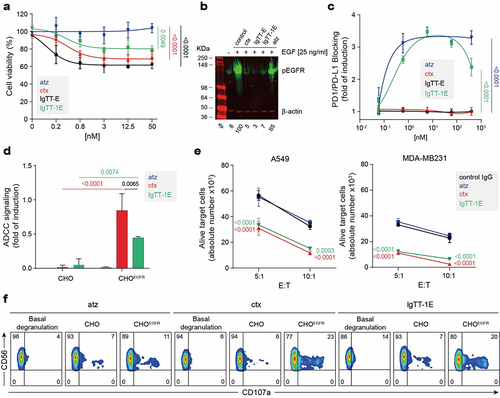
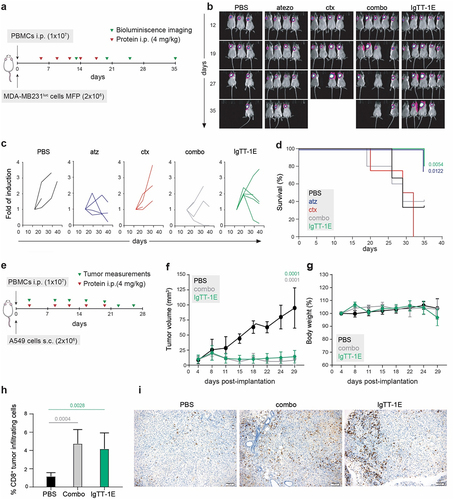
Figure 4. IgTT-1E treatment promoted significant tumor growth inhibition in NSG mouse models. (a) Timeline of experimental design. MDA-MB-231Luc cells were implanted into the right mammary fat pad (MFP) of NSG mice, and human PBMC were injected intraperitoneally (i.P.). Mice were treated with five i.P. injections of PBS, atz, ctx, atz + ctx (combo) or IgTT-1E. (b) Weekly bioluminescence imaging showing tumor progression. (c) Quantification of tumor burden (as bioluminescence fold induction from each mouse) at the indicated time points. (d) Kaplan-Meier plot of survival data. (e) Timeline of experimental design. NSG mice were subcutaneously (s.C.) inoculated with A549 tumor cells and i.P. with human PBMC, follow by five i.P. injections of PBS, atz + ctx combo or IgTT-1E. Tumor progression was monitored weekly by diameter measuring. (f) Average tumor volume growth in each mice group. Data are presented as the mean ± SD. Significance was determined by one-way ANOVA adjusted by the Bonferroni correction for multiple comparison test. (g) Change in mouse body weight over time for each group. (h) Quantitative analysis of intratumoral CD8+ T cells in paraffin-embedded mouse tumor tissue (PBS n = 4, combo n = 6, IgTT-1E n = 6) by immunohistochemistry. Data were calculated as percentage of CD8+ versus total cell number and presented as mean ± SD. Significance was measured by one-way ANOVA with Dunnett’s multiple comparisons test. (i) Immunohistochemical staining for CD8 of representative tissue slides from the tumor of mice treated with PBS, atz + ctx combo or IgTT-1E. Scale bars (100 µm) are shown.
Supplemental Material
Download MS Word (2.4 MB)Data availability statement
The datasets used and/or analyzed during the current study are available from the corresponding author [LA-V] on reasonable request.