1,669
Views
0
CrossRef citations to date
0
Altmetric
Original Research

A type I interferon footprint in pre-operative biopsies is an independent biomarker that in combination with CD8+ T cell quantification can improve the prediction of response to neoadjuvant treatment of rectal adenocarcinoma

ORCID Icon, , ORCID Icon, ORCID Icon, , ORCID Icon & ORCID Icon show all
Article: 2209473 | Received 28 Feb 2023, Accepted 27 Apr 2023, Published online: 10 May 2023

Figures & data

Table 1. Demographic characteristics of the study population.

Figure 1. Enumeration of T cells subsets in tumor tissue according to the effectiveness of treatment. (a) Bar charts show the mean density ±SEM of the CD3.+ T cells, CD3+CD8+ T cells, CD3+CD8+GrzB+ Cytotoxic T cells, and γδTCR+cells per mm2of the area according to the patients’ response to treatment in whole tumor tissue. (b) In the epithelium 50µm surrounding area (c) and only epithelium. (d) Bar charts show the mean density ±SEM of the T cells subsets per mm2 of the whole tumor tissue in complete responders v.s non-responders in whole tumor tissue. (e) In the epithelium and the area with 50µm width around it (f) and only epithelium. GrzB: Granzyme B, TRG: Tumor Regression Grade. Wilcoxon's rank sum test p <0.05 considered significant; n=130.

Figure 1. Enumeration of T cells subsets in tumor tissue according to the effectiveness of treatment. (a) Bar charts show the mean density ±SEM of the CD3.+ T cells, CD3+CD8+ T cells, CD3+CD8+GrzB+ Cytotoxic T cells, and γδTCR+cells per mm2of the area according to the patients’ response to treatment in whole tumor tissue. (b) In the epithelium 50µm surrounding area (c) and only epithelium. (d) Bar charts show the mean density ±SEM of the T cells subsets per mm2 of the whole tumor tissue in complete responders v.s non-responders in whole tumor tissue. (e) In the epithelium and the area with 50µm width around it (f) and only epithelium. GrzB: Granzyme B, TRG: Tumor Regression Grade. Wilcoxon's rank sum test p <0.05 considered significant; n=130.

Figure 2. Enumeration of MxA+ cells in tumor stroma. (a) Bar charts show the mean density ±SEM of MxA+ Pan-CK cells per mm2 of the tumor stroma according to the patients’ response to the treatment. (b) Bar charts show the mean density ±SEM of the MxA+ cells per mm2 of tumor stroma amongst complete responders and non-responders. TRG: Tumor Regression Grade. Wilcoxon's rank sum test; p <0.05 considered significant; n=130.

Figure 2. Enumeration of MxA+ cells in tumor stroma. (a) Bar charts show the mean density ±SEM of MxA+ Pan-CK− cells per mm2 of the tumor stroma according to the patients’ response to the treatment. (b) Bar charts show the mean density ±SEM of the MxA+ cells per mm2 of tumor stroma amongst complete responders and non-responders. TRG: Tumor Regression Grade. Wilcoxon's rank sum test; p <0.05 considered significant; n=130.

Figure 3. Classification of the patients according to the effectiveness of treatment. (a)The frequency of patients with CD3+ (Left-Upper), CD8+ (Middle –Upper) and MxA+ (Right-Upper), low (Blue), intermediate (White), and high (Red) according to tumor regression and the frequency of ISB (Left-Lower) and ISMxA+CD8+ (Right-Lower) low, intermediate, and high according to tumor regression. (b) The frequency of patients with either CD8+ or MxA+ high, intermediate and low according to the tumor regression. TRG: Tumor Regression Grade. Unilateral linear-by-linear association test; p <0.05 considered significant; n=130.

Figure 3. Classification of the patients according to the effectiveness of treatment. (a)The frequency of patients with CD3+ (Left-Upper), CD8+ (Middle –Upper) and MxA+ (Right-Upper), low (Blue), intermediate (White), and high (Red) according to tumor regression and the frequency of ISB (Left-Lower) and ISMxA+CD8+ (Right-Lower) low, intermediate, and high according to tumor regression. (b) The frequency of patients with either CD8+ or MxA+ high, intermediate and low according to the tumor regression. TRG: Tumor Regression Grade. Unilateral linear-by-linear association test; p <0.05 considered significant; n=130.

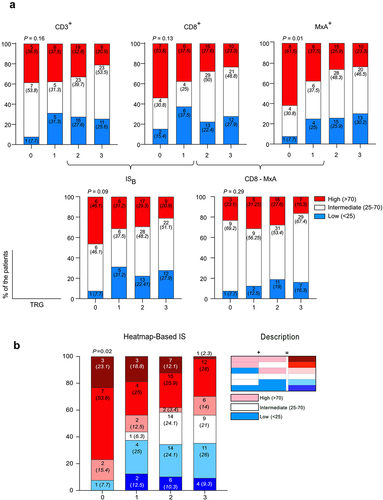
Table 2. Sensitivity, specificity, and diagnostic odds ratio of immune markers in prediction of response to treatment.

Supplemental material

Supplemental Material

Download PDF (2.8 MB)

Data availability statement

Data are available within the article and supplementary material.