
Figures & data
Figure 1. Differences in vaccine effectiveness by irradiated whole tumor cells.
Each tumor cell (2 × 10⁶ cells) was resuspended in PBS (200 µl) and inoculated subcutaneously into the right back of syngeneic female mice after X-rays (300 Gray). Two weeks after vaccination, each tumor cell (5 × 10⁴ cells) of the same type as at the time of vaccination was resuspended in PBS (200 µl) and inoculated subcutaneously into the left mammary gland. The day a palpable tumor could be confirmed was defined as tumor onset day in the Kaplan–Meier plot. (a, b) Kaplan–Meier plot of tumor-free in BALB/c or C57BL/6 mice vaccinated with 4T1A (n = 6), 3LL (n = 5), B16 (n = 5), 4T1S (n = 6), CT26 (n = 6), or MCA205 (n = 5) cells after radiation. Mice were challenged with 4T1A, 3LL, B16, 4T1S, CT26, or MCA205 cells 2 weeks after the vaccination, respectively. Values were analyzed by a Log-rank test. Asterisk indicates a significant difference; **P<0.01, compared with the control group.
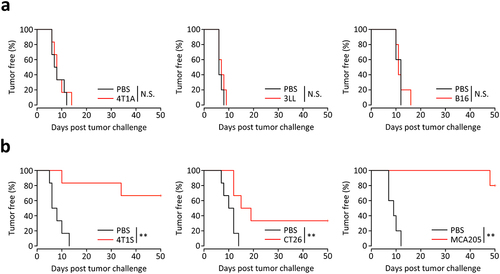
Table 1. Highly expressed genes in vaccine-effective cancer cells after radiation.
Table 2. Interferon family gene expression in each radiated cancer cell.
Figure 2. Vaccine effectiveness by each irradiated transgenic whole tumor cell.
Each tumor cell (2 × 10⁶ cells) was resuspended in PBS (200 µl) and inoculated subcutaneously into the right back of syngeneic female mice after X-rays (300 Gray). Two weeks after vaccination, each wild-type tumor cell (5 × 10⁴ cells) was resuspended in PBS (200 µl) and inoculated subcutaneously into the left mammary gland. The day a palpable tumor could be confirmed was defined as tumor onset day in the Kaplan–Meier plot. (a-e) Kaplan–Meier plot of tumor-free and overall survival in BALB/c mice vaccinated with Irf7 transgenic 4T1A (n = 10) or CT26 (n = 10), Irf7/Ifi44 transgenic 4T1A (n = 4), and Irf7/Ifi44/Usp18 transgenic 4T1A (n = 11) or CT26 (n = 10) cells after radiation. Mice were challenged with each wild-type cell 14 days after the vaccination. Values were analyzed by a Log-rank test. Asterisk indicates a significant difference; *P<0.05, **P<0.01, ***P<0.001, compared with the control group.
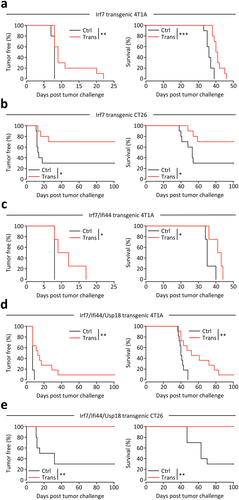
Figure 3. Effects of Irf7 on vaccine effectiveness by radiated whole tumor cells. .
Irf7-, Ifi44-, or Usp18-transgenic cells were generated by transfecting Irf7-, Ifi44-, or Usp18-expressing plasmid into tumor cells. Irf7KO cell line was generated by transfecting Irf7 double nickase plasmid into tumor cells. For in vivo prophylactic vaccination assay, each tumor cell (2 × 10⁶ cells) was resuspended in PBS (200 µl) and inoculated subcutaneously into the right back of syngeneic female mice after X-rays (300 Gray). Two weeks after vaccination, wild-type tumor cells (5 × 10⁴ cells) were resuspended in PBS (200 µl) and inoculated subcutaneously into the left mammary gland. The day a palpable tumor could be confirmed was defined as tumor onset day in the Kaplan–Meier plot. (a) Bar graphs represent the gene expression of Irf7, Ifi44, and Usp18 in Ctrl, Irf7 transgenic, Ifi44 transgenic, and Usp18 transgenic 4T1A cell lines (n = 5). (b) Bar graphs represent the gene expression of Ifi44 and Usp18 in Ctrl and Irf7 transgenic CT26 cell lines (n = 2). (c) Western blotting of Irf7 in 4T1A, 4T1S, and Irf7KO 4T1S cell lines with/without radiation. α Tubulin served as an internal positive control. The bands are quantified by ImageJ and shown in red letters. (d) Kaplan–Meier plot of tumor-free and overall survival in BALB/c mice vaccinated with Ctrl (n = 6) and Irf7KO 4T1S (n = 8) cells after radiation. Mice were challenged with 4T1S cells 14 days after the vaccination. Gene expression levels were determined by RT-PCR, as normalized to Gapdh. Values were analyzed by a Tukey–Kramer test (a) and a Log-rank test (d) and are shown as mean±SEM (a). Asterisk indicates a significant difference; *P<0.05, **P<0.01, ***P<0.001, compared with the control group.
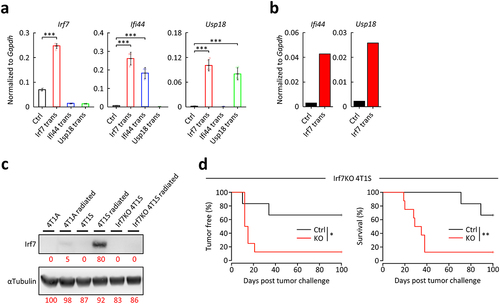
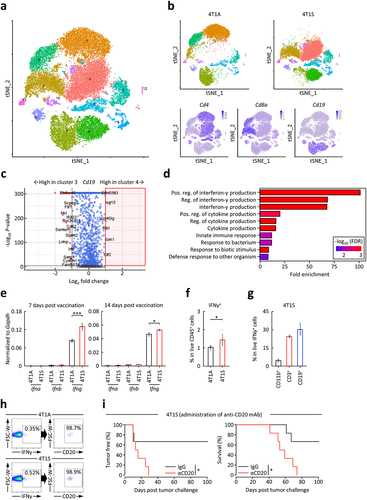
Figure 4. Effects of IFNγ+ B cells on vaccine effectiveness by irradiated whole tumor cells.
Lymph nodes of each mouse were collected 14 days after vaccination with 4T1A or 4T1S and prepared as single-cell libraries, then sequenced on the next-generation sequencer. Based on acquired raw sequencing data, gene expression matrices for each cell were generated. The resulting count matrices were further processed using the Seurat to remove low-quality cells. Then, t-distributed stochastic neighbor embedding (tSNE) projections allowed us to assign cells to 12 clusters. Cell types were annotated using the Louvain algorithm based on known cell markers and differential gene expression analysis. Highly expressed genes in CD4, CD8a, and CD19 clusters within 4T1S vaccinated murine lymph node cells were identified by mean expression and variance compared to 4T1A vaccinated murine lymph node cells and were visualized using the Volcano plots. For in vivo prophylactic vaccination assay, tumor cells (2 × 10⁶ cells) were resuspended in PBS (200 µl) and inoculated subcutaneously into the right back of syngeneic female mice after X-rays (300 Gray). Two weeks after vaccination, tumor cells (5 × 10⁴ cells) of the same type as at the time of vaccination were resuspended in PBS (200 µl) and inoculated subcutaneously into the left mammary gland. Anti-CD20 antibodies (250 µg) were intraperitoneally administered 7 days before, one day before, and 7 days after vaccination. The day a palpable tumor could be confirmed was defined as tumor onset day in the Kaplan–Meier plot. (a) tSNE projection represent all lymph node cells of both 4T1A and 4T1S vaccinated mice that passed quality control (n = 36814 cells). Twelve clusters were defined and indicated by different colors. (b) tSNE projection represents lymph node cells of 4T1A or 4T1S vaccinated mice (4T1A: n = 16295 cells, 4T1S: n = 20519 cells). The purple color highlights the Cd4, Cd8a, and Cd19 clusters. (c) Volcano plots of differentially expressed genes (P<0.01) in Cd19+ cells of 4T1S vaccinated mice. Black dots symbolize genes not significantly different, and each dot denotes a single gene. The x-axis is the fold change of gene expression (Log2) in each Cd19+ cell, and the y-axis represents Log10 of the P-value. (d) Gene ontology enrichment analysis of highly expressed genes in Cd19+ cells of 4T1S vaccinated mice. (e) Bar graphs represent the gene expression of Ifna, Ifnb, and Ifng in lymph node cells of 4T1A or 4T1S vaccinated mice (n = 3-5). Gene expression levels were determined by RT-PCR, as normalized to Gapdh. (f) Bar graphs represent the frequency of IFNγ+ cells within CD45+ cells in lymph node cells of 4T1A or 4T1S vaccinated mice (n = 5). (g) Bar graphs represent the frequency of CD11b+, CD3+, and CD19+ cells within IFNγ+ cells in lymph node cells of 4T1S vaccinated mice (n = 3). (h) Representative plots of IFNγ+ cells within CD19+ cells (left) and CD20+ cells gated from them (right) in lymph node cells of 4T1A or 4T1S vaccinated mice. (i) Kaplan–Meier plot of tumor-free and overall survival in BALB/c mice vaccinated with 4T1S cells after radiation and administered with anti-CD20 antibodies (n = 6). Mice were challenged with 4T1S cells 14 days after the vaccination. Values were analyzed by a Tukey–Kramer test (c), a two-sided Student’s t-test (e-g), and a Log-rank test (i) and are shown as mean±SEM (e-g). Asterisk indicates a significant difference; *P<0.05, ***P<0.001, compared with the control group.
Supplemental material
Supplemental Material
Download Zip (8.2 MB)Data availability statement
The datasets generated and/or analyzed during the current study are available from the corresponding author on reasonable request.