
Figures & data
Figure 1. Characterization of liver carcinoma cell lines.
(a) Tumor-free survival curve of Alb-HBs+ (n = 79) and AlfpCre+-Trp53fl/fl/Alb-HBs+ tg mice (n = 22). (b) Pie charts representing the specific distribution of liver carcinoma differentiation in Alb-HBs+ and AlfpCre+-Trp53fl/fl/Alb-HBs+ tg mice. (c) Primary liver carcinoma cells (pCCL) were established from liver tumors developed in AlfpCre+-Trp53fl/fl/Alb-HBs+ tg mice and analyzed for coexpression of HNF4α and CK7 by immunofluorescence as described in M&M. One representative photograph of each staining is shown. Scale bar: 20 μm. (d) A representative pCCL-1 was treated with 20 ng/mL recombinant mouse IFNγ for 20 h or remained untreated, followed by FCM of MHC-I (H2-Kb) and PD-L1 expression. One representative histogram out of three independent experiments is shown. (e) Similarly, pCCL-1 were treated with 20 ng/mL IFNγ for 20 h, washed with PBS and cultured for up to 7 d. The surface expression of MHC-I (open circles) and PD-L1 (closed squares) was measured by FCM at the indicated time points. One representative histogram out of three independent experiments is shown. MFI, Mean Fluorescent Intensity.
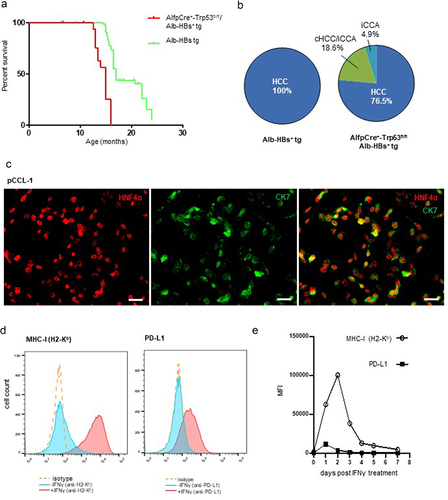
Figure 2. Growth of pCCL in transplanted B6 mice.
(a–d) Equal numbers (1 × 10⁶) pCCL-1 were subcutaneously transplanted into the left flank of B6 (a) or Rag1−/− mice (c) (n = 3), and tumor growth was monitored. (b,d) Tumors were explanted from these transplanted mice and cultured in vitro, generating pCCL-ex and pCCL-ex-Rag, respectively. The cell surface expression of H2-Kb and PD-L1 was assessed at passages 6 and 45, respectively (c,d). A representative histogram (out of three independently generated pCCL-ex and pCCL-ex-Rag) is shown. (e,f) Equal numbers (1 × 10⁶) of pCCL, pCCL-IFNγ (pCCL pretreated for 20 h with 20 ng/mL IFNγ) and pCCL-ex were subcutaneously transplanted into B6 (n = 3–6) (e) and PD1−/− mice (n = 5) (f) and tumor growth was monitored.
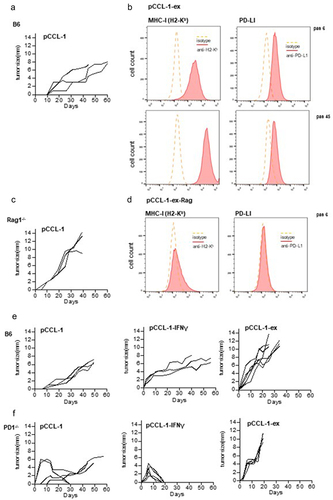
Figure 3. Gene expression signatures of different tumor cell lines.
(a) The gene expression pattern was determined in four independently generated pCCL, IFNγ pretreated pCCL-IFNγ and pCCL-ex, respectively. Unsupervised hierarchical clustering based on significant differentially expressed genes in pCCL, pCCL-IFNγ and pCCL-ex is shown. The red label indicates upregulated genes, while the blue label indicates downregulated genes. (b) The Venn diagram shows the number of significant differentially expressed genes in the pCCL-ex versus pCCL and pCCL-IFNγ versus pCCL comparisons. Furthermore, the numbers of up- and down-regulated genes are indicated. (c) GSEA and reactome pathway network analysis were performed on the 1163 significantly differentially expressed genes, determined in the comparison of pCCL-ex versus pCCL. The significantly enriched and differentially regulated pathway-associated genesets are described in detail in Table S1D,F.
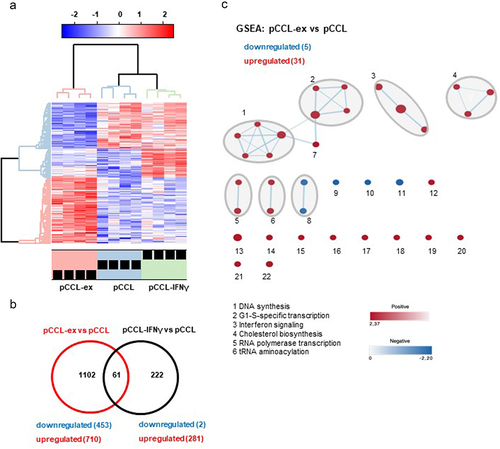
Figure 4. Characterization of the HBs-specific antigenicity.
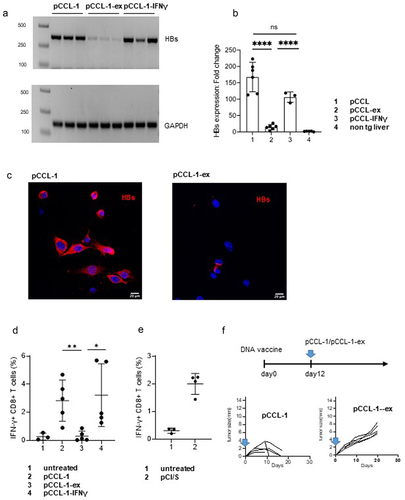
The mRNA levels of HBs were measured in representative pCCL-1, pCCL-1-ex and pCCL-1-IFNγ in triplicates by conventional PCR and agarose gel electrophoresis (a) or by RT-qPCR (b) (n = 3–6/group). (c) Representative pCCL-1 and pCCL-1-ex were analyzed for HBs expression (red) by immunofluorescence staining. Scale bar: 20 μm. Furthermore, nuclei were stained with DAPI (blue). (d) B6 mice were injected with equal numbers (1 × 10⁶) of pCCL-1, pCCL-1-ex or pCCL-1-IFNγ (n = 5) or remained untreated (n = 3). After 12 days, Kb/S190-197-specific IFN-γ+ CD8+ T-cell frequencies (±SD) in the spleen (%) are shown. The non-specific Kb/OVA257-264 frequencies, usually ≤0.2%, were subtracted from the presented values. (e) B6 mice were immunized with pCI/S (n = 4) or remained untreated (n = 3), and Kb/S190-197-specific IFN-γ+ CD8+ T cells were determined as described above. (f) B6 mice (n = 5) were immunized with pCI/S and, after 12 days, subcutaneously transplanted with equal numbers (1 × 10⁶) of pCCL-1 or pCCL-1-ex. Tumor growth was monitored. ns, not significant; *p < 0.05; **p < 0.01; ****p < 0.0001.
Supplemental material
Supplemental Material
Download Zip (1.8 MB)Data availability statement
All data relevant to this study are included in the article or uploaded as supplemental files. The original raw microarray datasets are accessible via GEO accession GSE215059; https://www.ncbi.nlm.nih.gov/geo/query/acc.cgi?acc=GSE215059