Figures & data
Figure 1. Number of scientific publications examining aspects of the migration-development nexus, and publications using QCA, 1990–2019.
Source: Based on Scopus data.
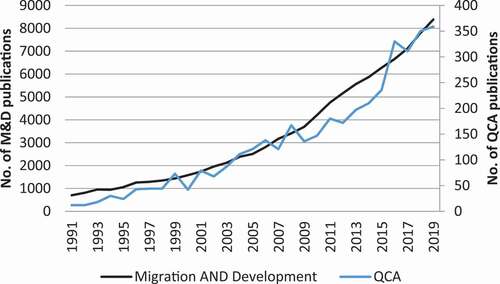
Figure 2. Empirical and non-empirical studies by migration driver dimension (N = 463).
Source: Czaika and Reinprecht (Citation2020)
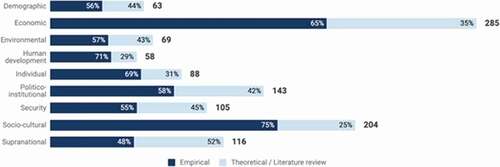
Figure 3. Venn-diagram of sufficient (left) and necessary (right) conditions.
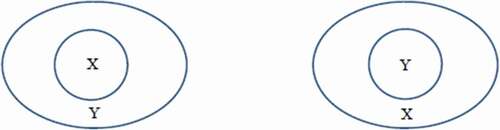
Figure 4. X-Y plot of sufficient (left) and necessary (right) conditions X for outcome Y.
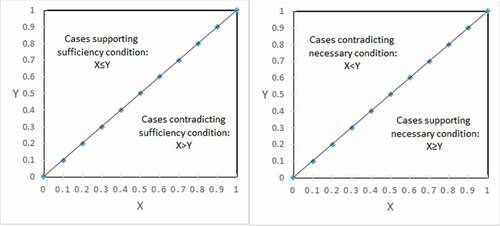
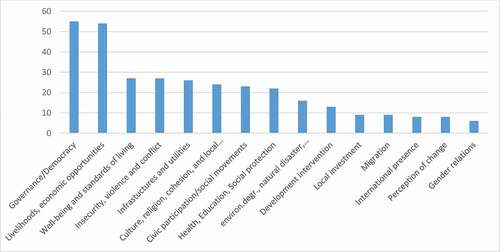
Figure 5. Number of development-related QCA publications per theme in COMPASSS database (N = 85).Footnote8