Figures & data
Figure 1. The derivation of the study sample.
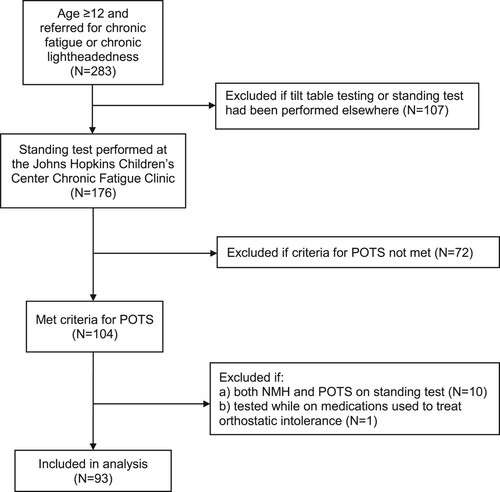
Figure 2. The correlation of paired pre-test and post-test supine heart rates for the full sample of 93 participants ((a)) and the medication-naïve subset of 58 ((b)).
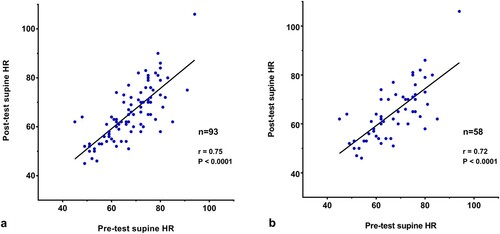
Table 1. Demographic and heart rate values during the standing test by HR group*.
Table 2. Proportions reporting increased orthostatic symptoms during 10 min of passive standing.
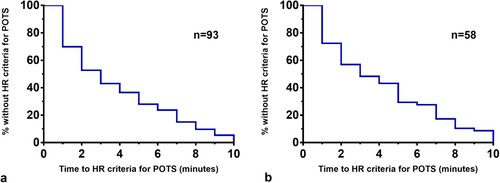
Figure 3. Survival curves illustrating the time during the standing test at which point the HR criteria for POTS could be confirmed for those in the full sample ((a)) or the medication-naïve subset ((b)).