Figures & data
Table 1. The table representing thresholds and stability of steady states.
Figure 1. The equilibrium point is stable for the parametric values as given in Table .
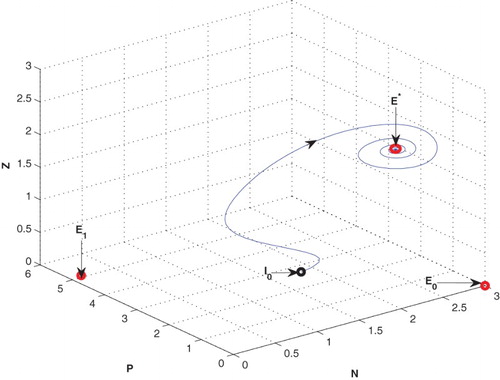
Table 2. A set of parametric values.
Figure 2. The figure depicts oscillatory behaviour around the positive interior equilibrium of the system (2.1) for increasing
from 3 to 5.5 with same set of parametric values as given in Table .
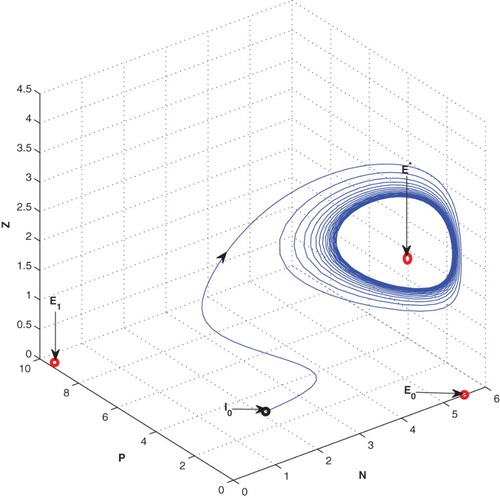
Figure 3. The figure depicts stable behaviour at of the system (2.1) for
with same set of parametric values as given in Table .
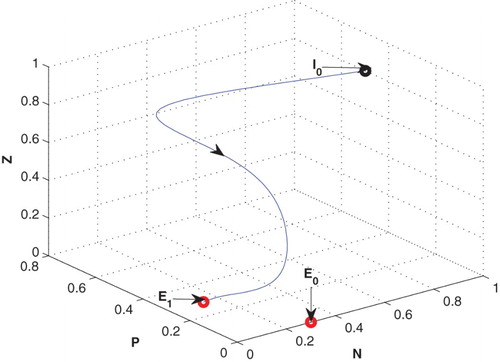
Figure 4. The figure depicts oscillatory behaviour around the positive interior equilibrium of the system (2.1) for increasing D from 0.3 to 0.85 with same set of parametric values as given in Table .
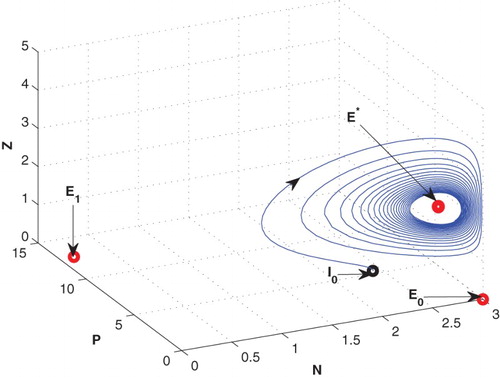
Figure 5. The figure depicts stable behaviour at of the system (2.1) for D=0.02 with same set of parametric values as given in Table .
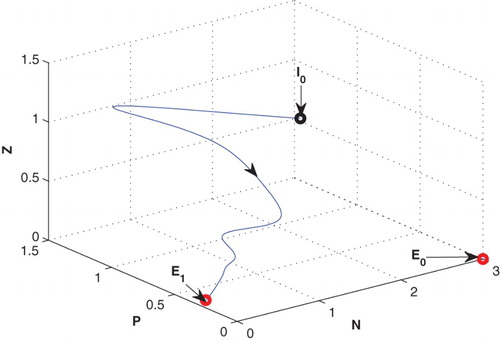
Figure 6. The figure depicts oscillatory behaviour around the positive interior equilibrium of the system (2.1) for decreasing the value of
from 3 to 0.25 with same set of parametric values as given in Table .
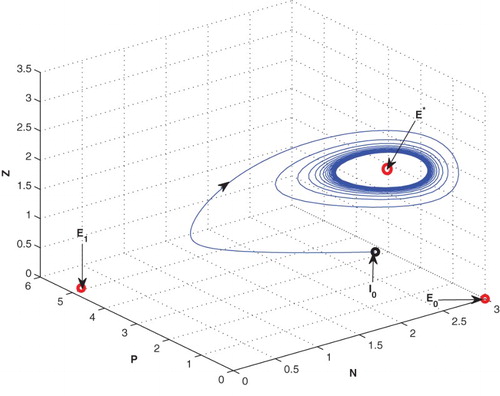
Figure 7. The figure depicts stable behaviour at of the system (2.1) for G1=0.15 with same set of parametric values as given in Table .
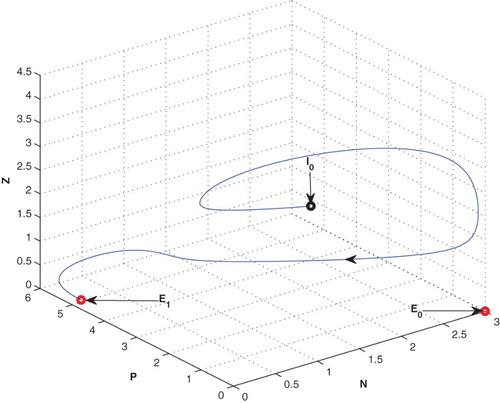
Figure 8. The figure depicts stable behaviour at of the system (2.1) for increasing the value of
with same set of parametric values as given in Table .
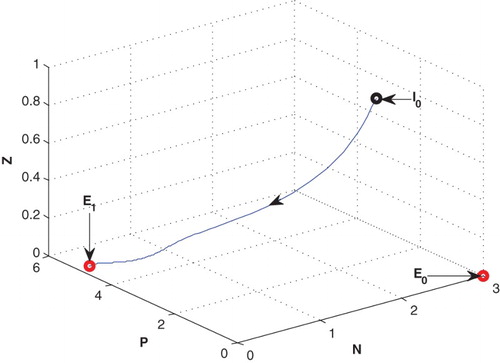
Figure 9. (a) The figure depicts different steady-state behaviour of nutrient for the effect of . (b) The figure depicts different steady-state behaviour of phytoplankton for the effect of
. (c) The figure depicts different steady-state behaviour of zooplankton for the effect of
with other parametric values as given in Table .
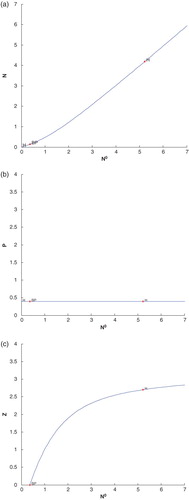
Figure 10. (a) The figure depicts different steady-state behaviour of nutrient for the effect of D. (b) The figure depicts different steady-state behaviour of phytoplankton for the effect of D. (c) The figure depicts different steady-state behaviour of zooplankton for the effect of D with other parametric values as given in Table .
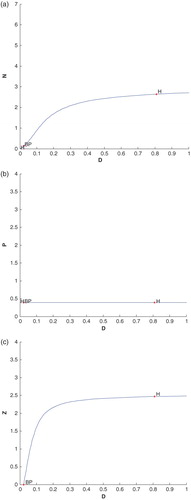
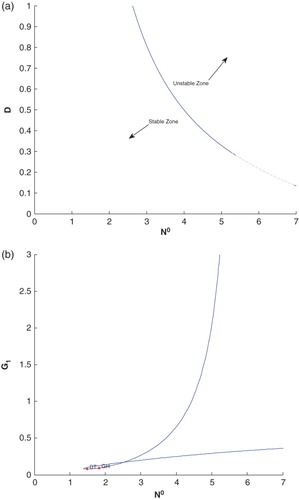
Figure 11. (a) The two parameter bifurcation diagram for –D with all parametric values as given in Table of the system (2.1). (b) The two parameter bifurcation diagram for
–
with all parametric values as given in Table of the system (2.1).