Figures & data
Figure 1. Meshing process of spur gear pairs.
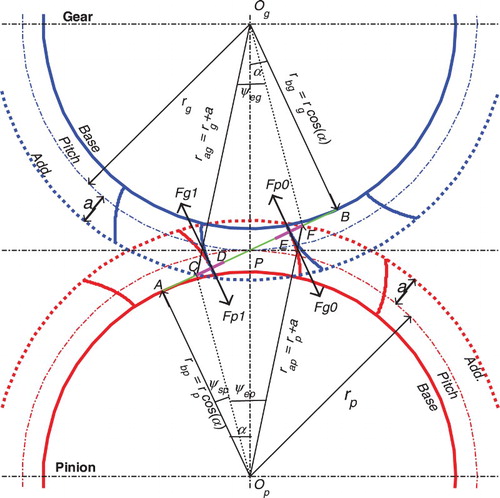
Figure 2. Mesh stiffness regions of meshing gear pair in one period.
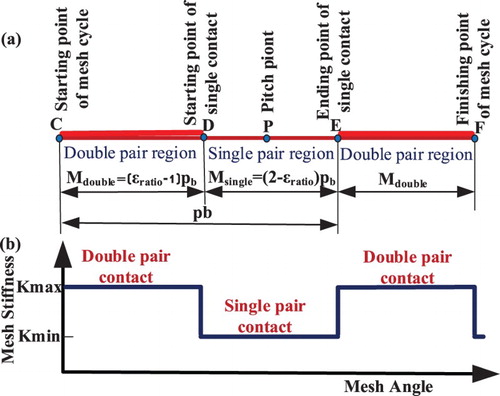
Figure 3. Time-varying mesh stiffness variations with different TB severities.
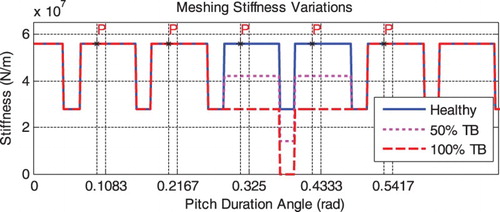
Figure 4. Variation of normal contact forces, friction forces and frictional torque with the pitch period.
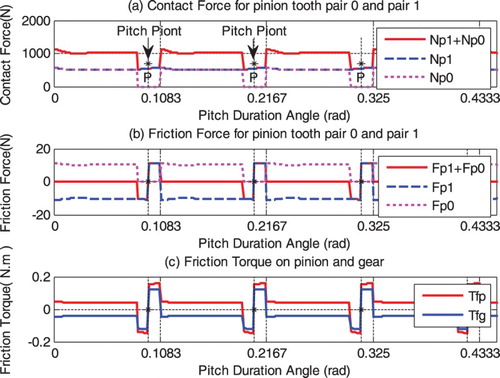
Figure 5. Sliding velocity and friction coefficient signals of pair0 and pair1 during the mesh process.
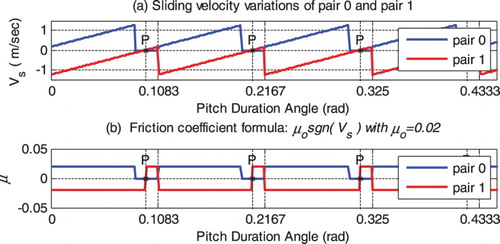
Figure 6. Schematic diagram of gear dynamic model with friction.
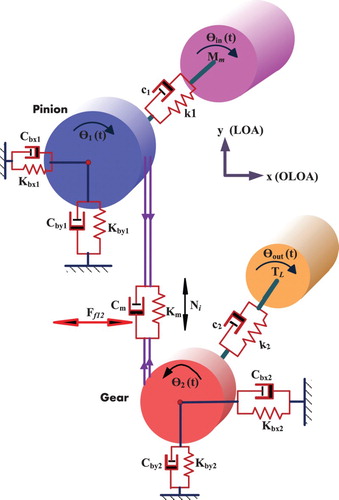
Table 1. Geometric property of the meshing gears.
Figure 7. A simulation procedure used in this study.
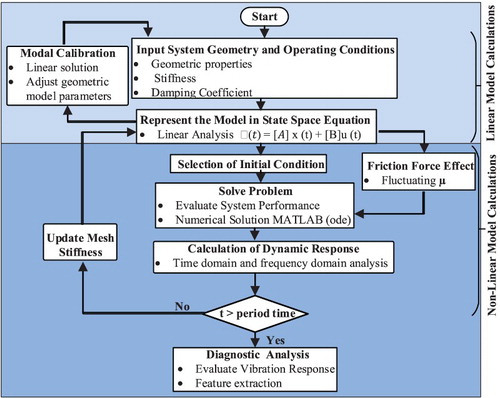
Figure 8. Frequency responses of gear system excited with impulsive inputs at the pinion and gear.
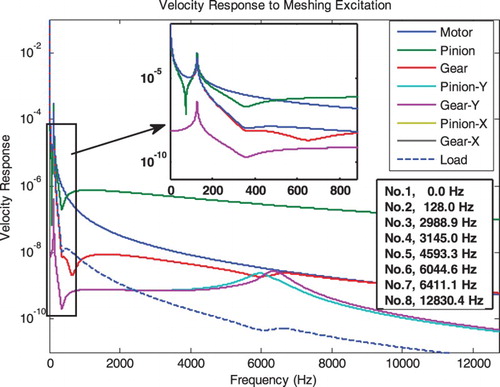
Figure 9. Vibration responses in the time domain and frequency domain.
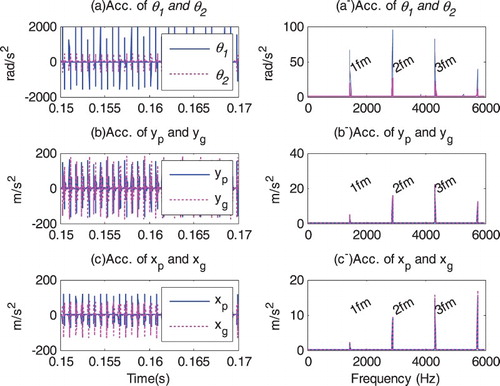
Figure 10. Effect of friction on motor operating parameters.
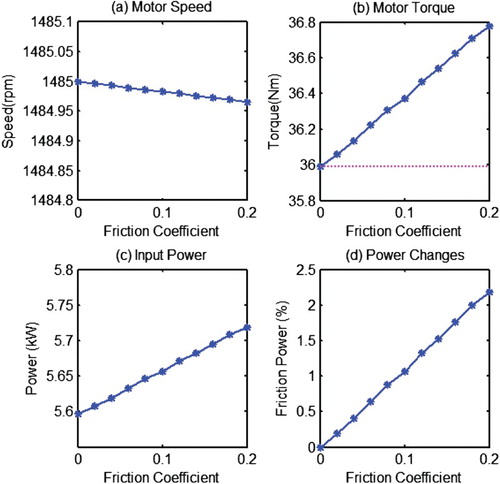
Figure 11. RMS of acceleration signals in rotation and translation transverse for pinion and gear.

Figure 12. Rotation responses at mesh frequency with friction.
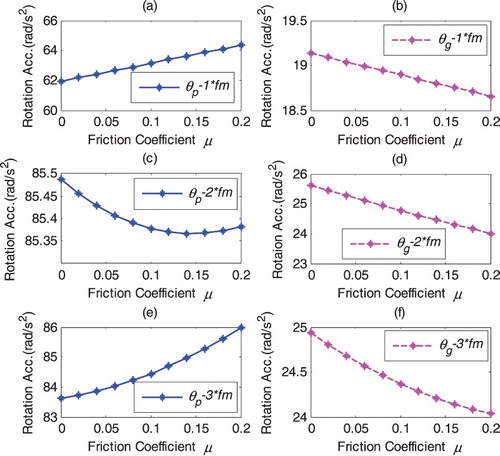
Figure 13. Spectral peaks of translation responses in Y-direction (LOA).
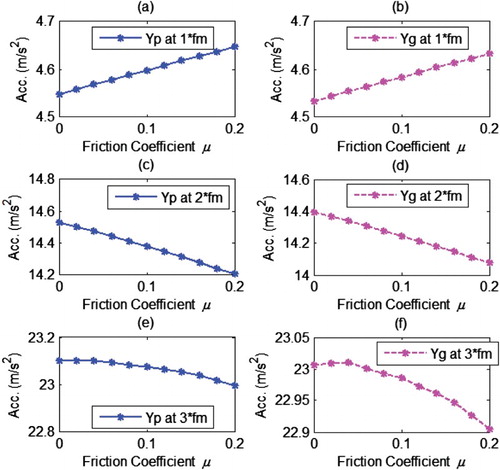
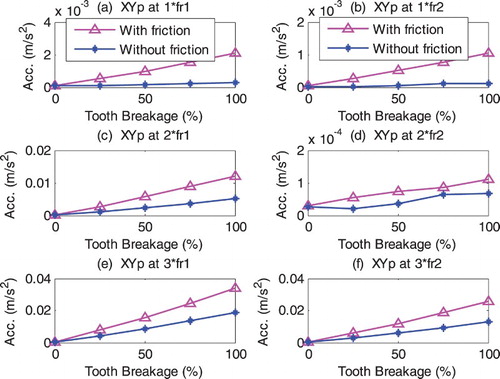
Figure 14. Spectral peaks of translation responses in X-direction (OLOA).
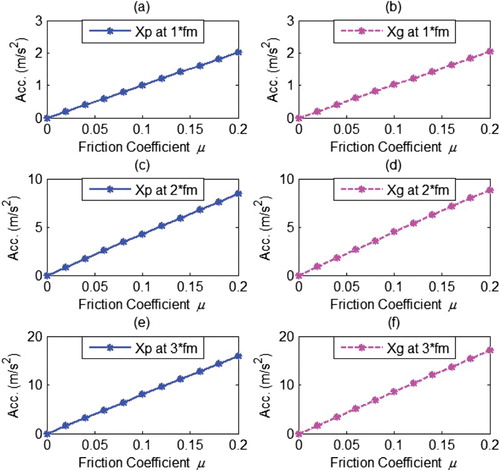
Figure 15. Spectral peaks of combined translation responses.
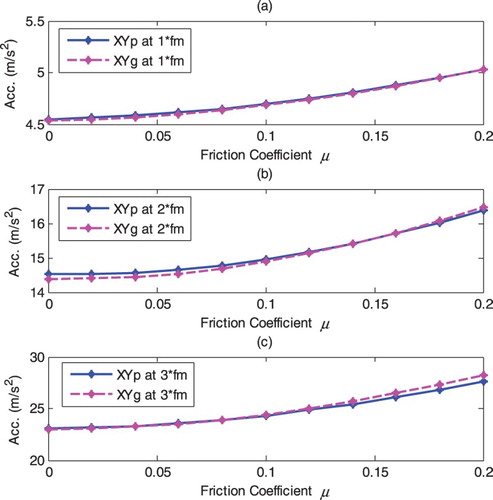
Figure 16. Translation spectrum responses of healthy and one TB with and without frictional effect.
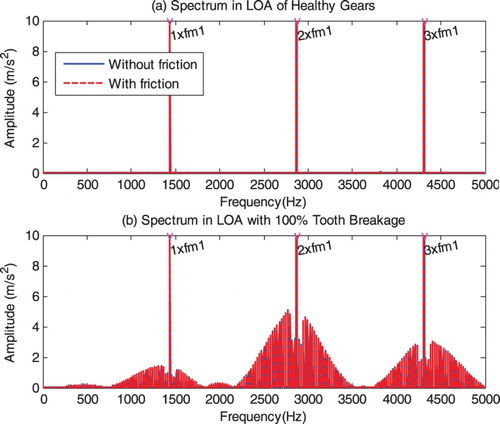
Figure 17. Spectral peaks at the sideband frequencies of the meshing frequency harmonics.
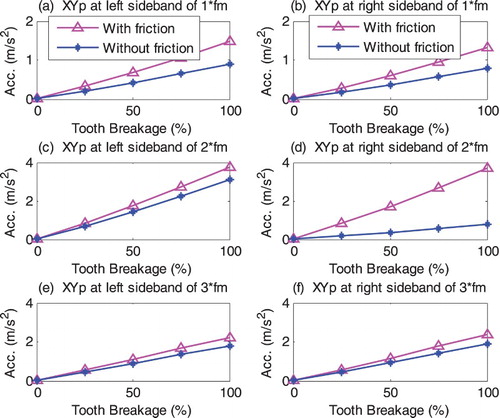
Figure 18. Spectral peaks at the rotation frequencies.