Figures & data
Figure 1. Yaw moment control aspects.
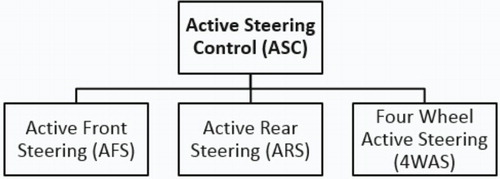
Figure 2. Linear bicycle model.
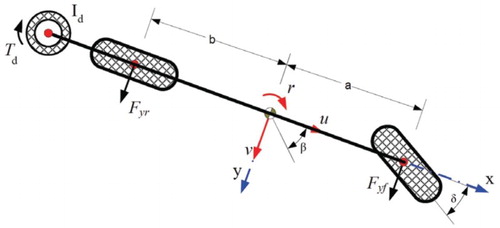
Figure 3. Control system structure.
Figure 4. Torque controller unit.
Figure 5. Controller gains vs. longitudinal velocity of vehicle. (a) Lateral velocity gain. (b) Vehicle’s yaw rate gain. (c) Disc angular velocity gain. (d) Steering angle gain.
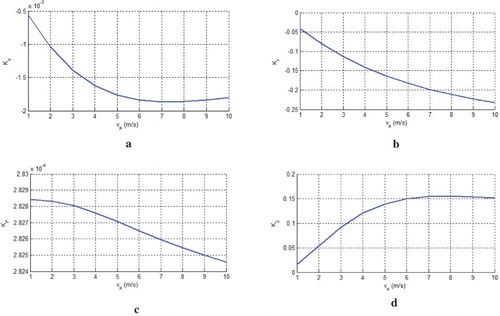
Figure 6. Developed RC model prototype with momentum wheel. (a) Scaled RC model car. (b) Momentum wheel (disk and DC motor).
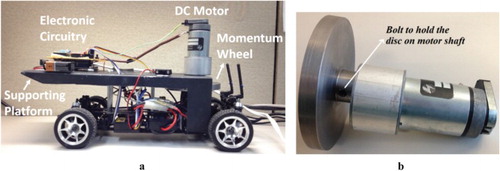
Figure 7. Hardware structure diagram.
Figure 8. Experimental test setup with the vehicle prototype.
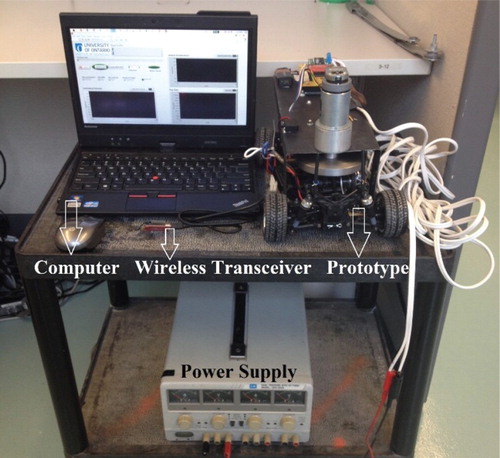
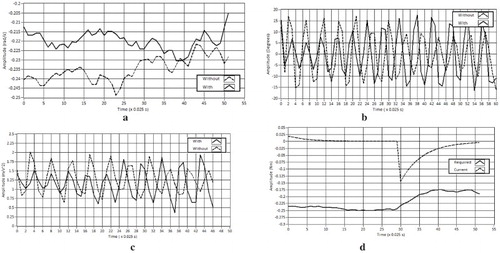
Figure 9. Low-friction road test results. (a) Yaw rate. (b) Side-slip angle. (c) Lateral acceleration. (d) Torque.
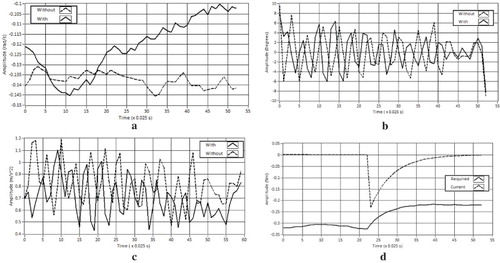
Table 1. The RMS values of the vehicle measures for low-friction road test.
Figure 10. High-friction road test results. (a) Yaw rate. (b) Side-slip angle. (c) Lateral acceleration. (d) Torque.