
Figures & data
Figure 1. Typical turnaround day at a port.
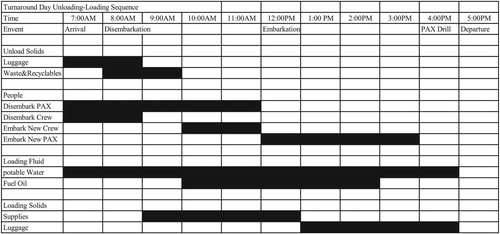
Figure 2. Network diagram of cruise ship supply distribution.
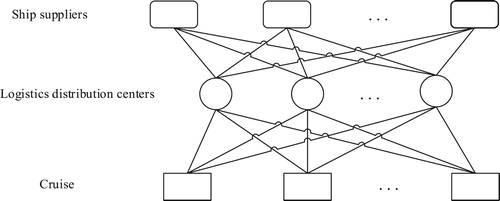
Table 1. Symbols and definitions of various parameters and variables.
Figure 3. Flow chart of Benders decomposition algorithm.
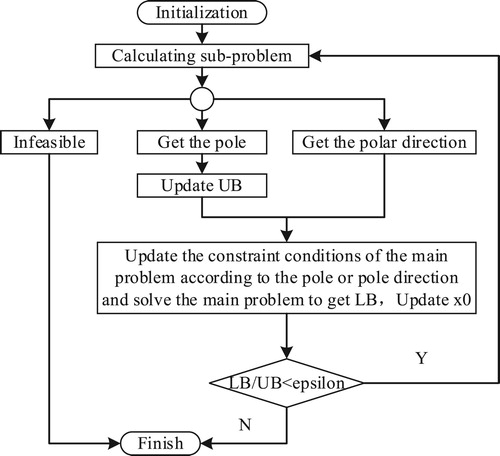
Figure 1. Typical turnaround day at a port.
Figure 2. Network diagram of cruise ship supply distribution.
Figure 3. Flow chart of Benders decomposition algorithm.