Figures & data
Figure 1. AKPCA monitoring flowchart.
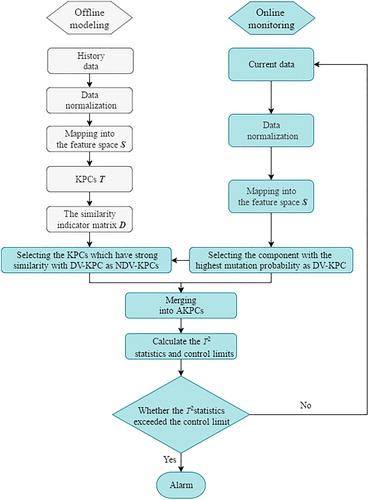
Figure 2. Monitoring results of KPCA and AKPCA for case 0 in TE process.
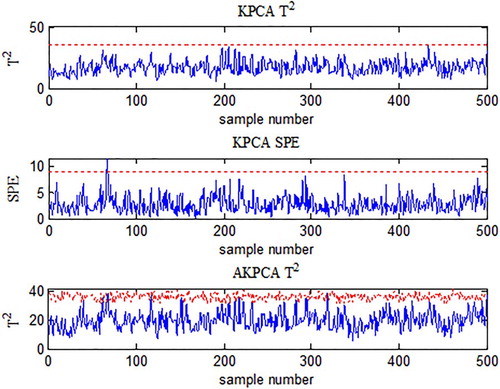
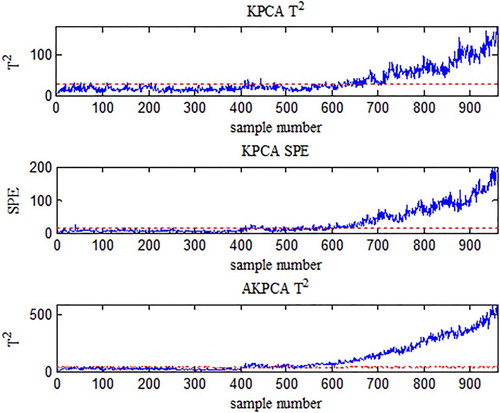
Figure 3. Monitoring results of KPCA and AKPCA for case 4.
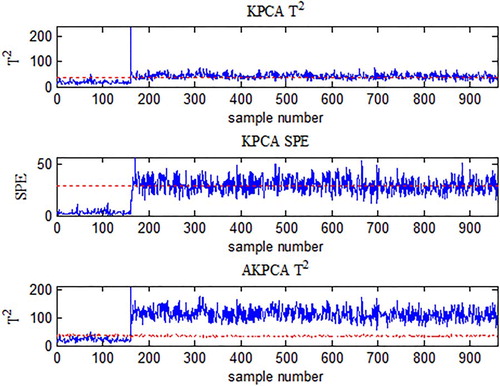
Figure 4. The mutation probabilities of KPCs at four sample points for fault 4.
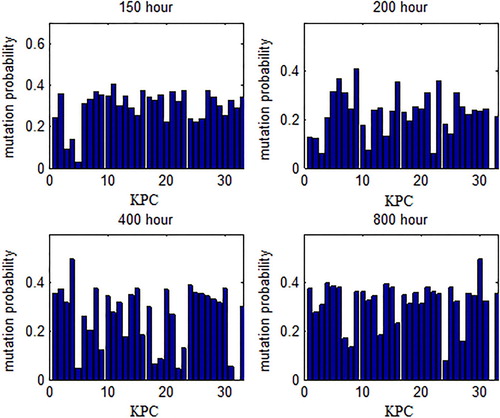
Figure 5. The similarity between DV-KPC and other KPCs at four sample points for fault 4.
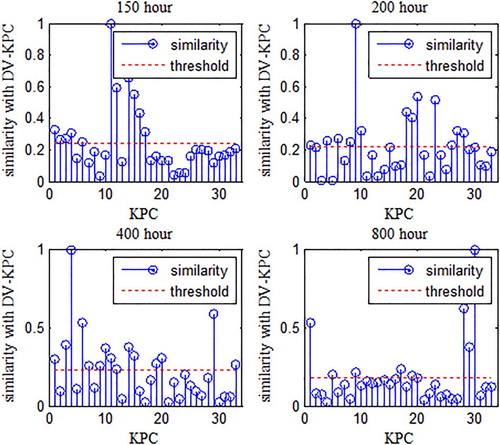
Figure 6. The monitoring effect diagram of DV-KPC and NDV-KPCs for fault 4.
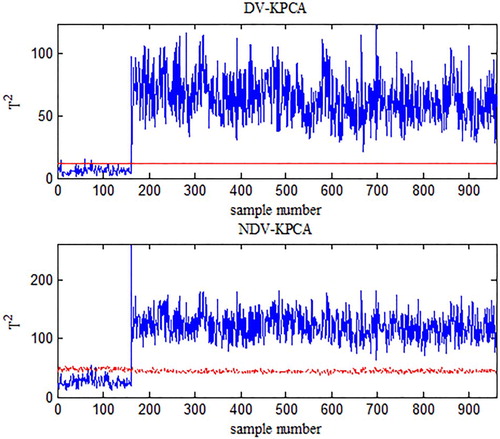
Table 1. The serial numbers of AKPCs at 150, 200, 400, and 800 sample points.
Figure 7. The monitoring results of KPCA and AKPCA for Case 19.
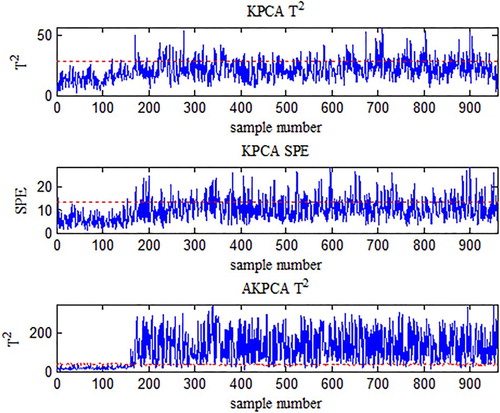
Figure 8. The monitoring results of KPCA and AKPCA for Case 21.