Figures & data
Table 1. Main parameters' symbols and implications of the three-party evolutionary game model.
Table 2. Payoff matrix of the mixed strategy game model among the merchant, e-commerce platform, and consumer.
Figure 1. Phase diagram of the merchant's strategy evolution. It shows the relationship between the merchant's ESS and the probability z. Arrows represent the merchant's strategy choice.
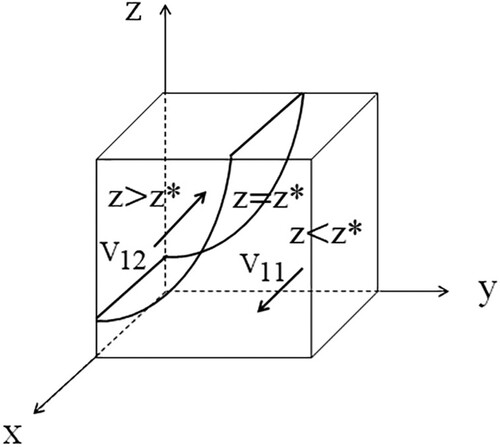
Figure 2. Phase diagram of the e-commerce platform's strategy evolution. It shows the relationship between the e-commerce platform's ESS and the probability x. Arrows represent the e-commerce platform's strategy choice.
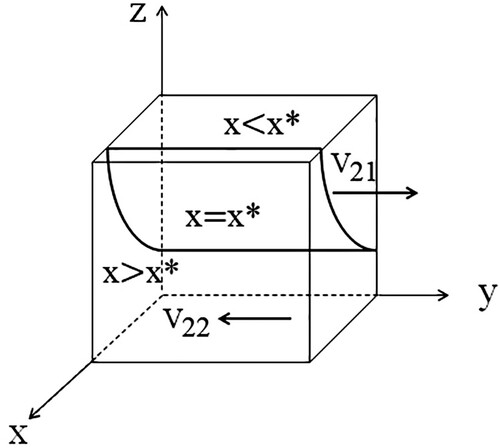
Figure 3. Phase diagram of the consumer's strategy evolution. It shows the relationship between the consumer's ESS and the probability y. Arrows represent the consumer's strategy choice.
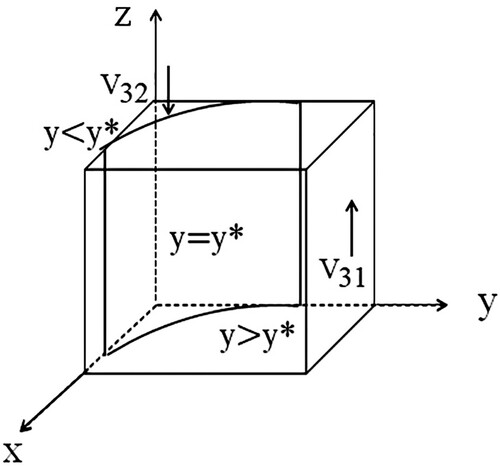
Table 3. Stability analysis of equilibrium points.
Figure 4. Influence of economic penalty F's changes on x, y, and z. (a) Influence of F's changes on x, y, and z and (b) influence of F's changes on x and y.
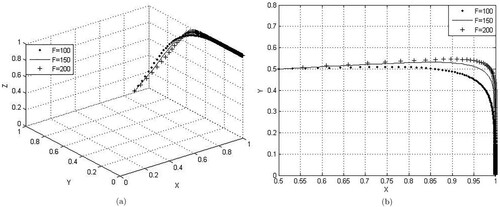
Figure 5. Influence of supervision cost 's changes on probabilities x, y, and z. (a) Influence of
's changes on x, y and z and (b) influence of
's changes on y with time t.
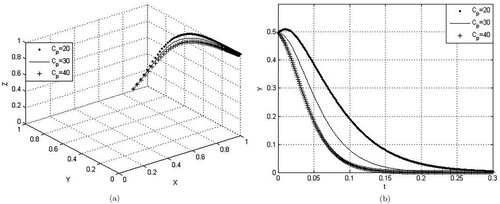
Figure 6. Influence of economic losses 's changes brought by negative online word of mouth on x, y, and z. (a) Influence of
's changes on x, y, and z and (b) influence of
's changes on x with time t.
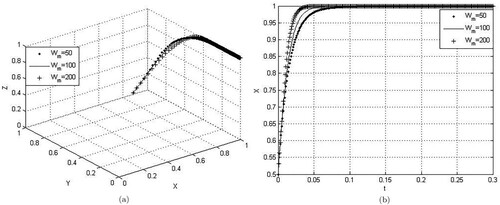
Figure 7. Influence of economic compensation I's changes on probabilities x, y, z. (a) Influence of I's changes on x, y, and z and (b) influence of I's changes on x and z.
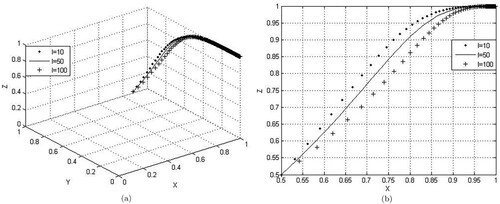
Figure 8. Influence of economic penalty F's changes on probabilities x and y with time t. (a) Influence of F's changes on x with time and (b) influence of F's changes on y with time.
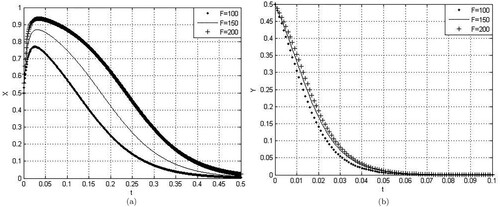
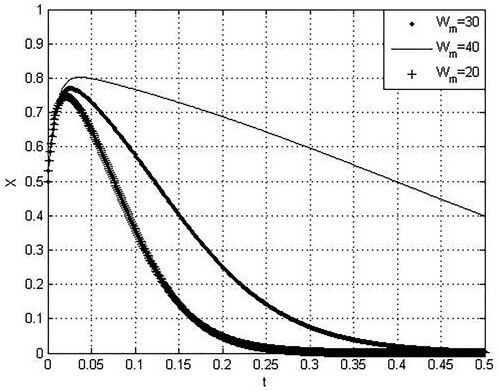
Figure 9. Influence of supervision cost 's changes on the probability y with time t.
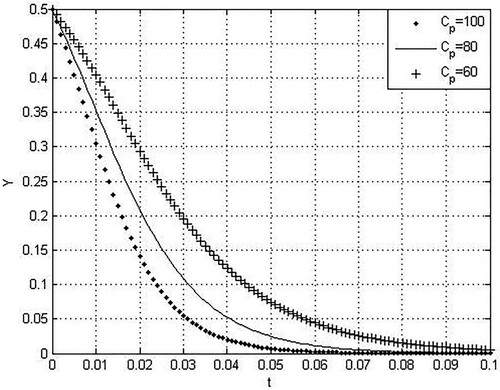
Figure 10. Influence of loss 's changes brought by negative online word of mouth on the probability x with time t.