Figures & data
Figure 1. Schematic diagram of one-area LFC scheme.
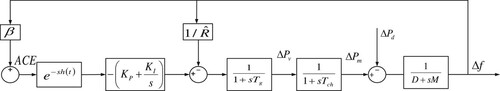
Table 1. Admissible upper bounds h for given μ.
Table 2. Maximum delay upper bounds with
.
Table 3. Maximum delay upper bounds h comparisons with .
Table 4. Maximum delay upper bounds h with .
Table 5. Maximum delay upper bounds h with ,
.
Table 6. Allowable minimum with h = 2.
Table 7. Allowable minimum with
,
.
Table 8. Allowable minimum comparisons with h = 2.
Figure 2. State response trajectory with ,
by Corollary 3.1.
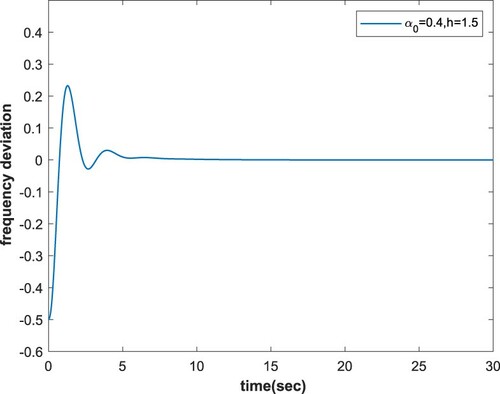
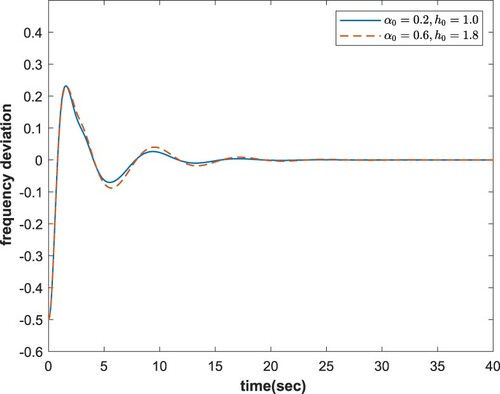
Figure 3. State response trajectories with ,
by Theorem 3.1.
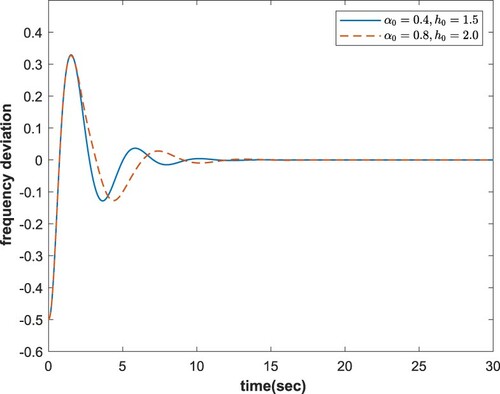
Figure 4. State response trajectory with ,
by Corollary 3.1.
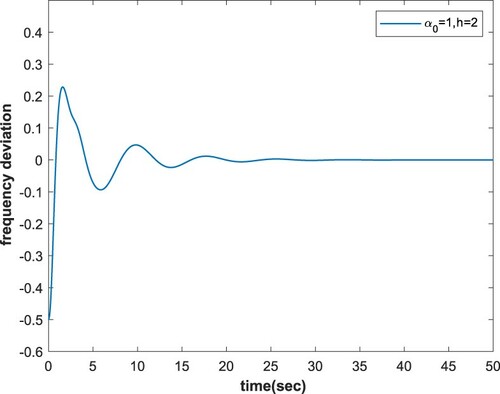
Figure 5. State response trajectories with ,
by Theorem 3.1.