
Figures & data
Figure 1. Head gimbal assembly (HGA).
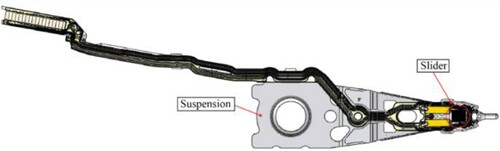
Figure 2. HGA process (a) Adhesive dispensing, (b) Slider attachment, (c) Adhesive cure and (d) Soldering.
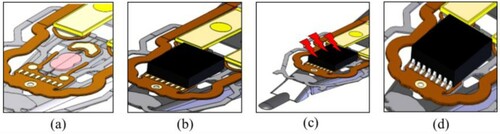
Figure 3. (a) ACAM machine and (b) clamping unit in ACAM machine.
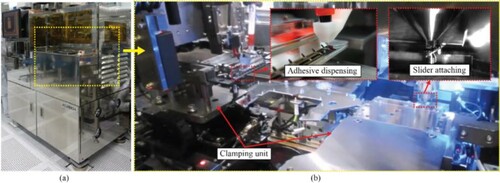
Figure 4. (a) The impact of vibrations on reference hole positioning and (b) fault position of adhesive dispensing and (c) attached slider misalignment.
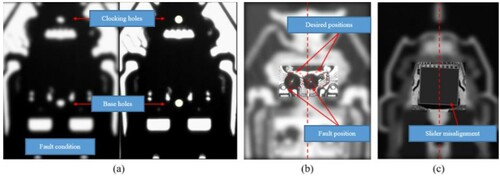
Figure 5. (a) Linear bearing and (b) ball bearing element.
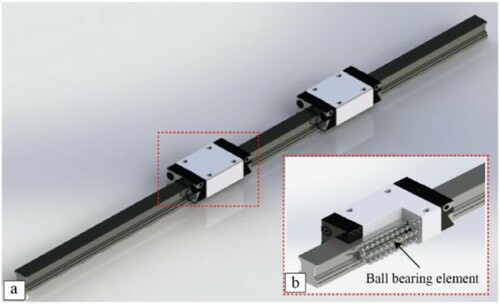
Figure 6. Ball bearing structure and physical parameters.
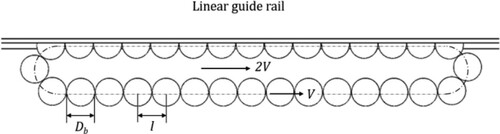
Figure 7. Spectrum of the vibration signal.
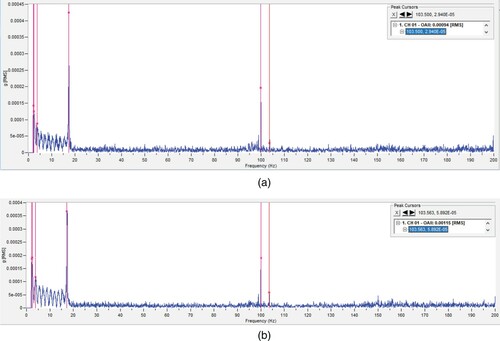
Table 1. The influence of speed on fault frequency.
Figure 8. FDD non-model-based classification.
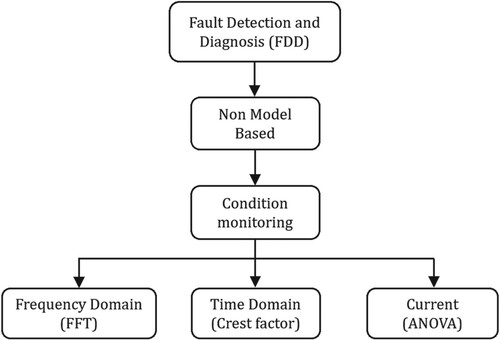
Figure 9. (a) The experiment set-up and (b) DAQ system.
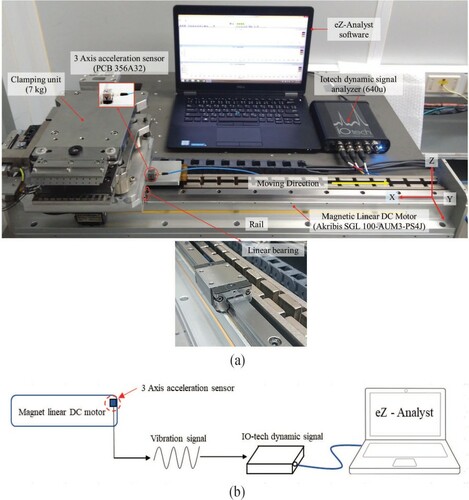
Figure 10. Microphotograph of the damage on the ball bearing element.
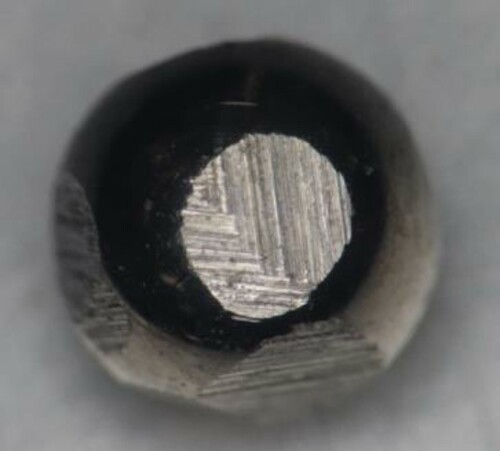
Figure 11. Ball bearing loss.
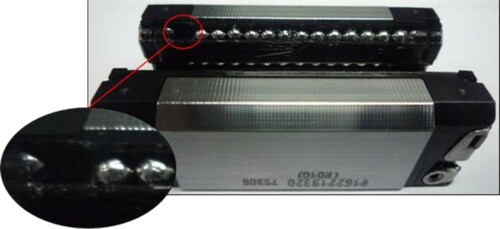
Figure 12. Removal of contaminate and lubricant using ultrasonic cleaner.
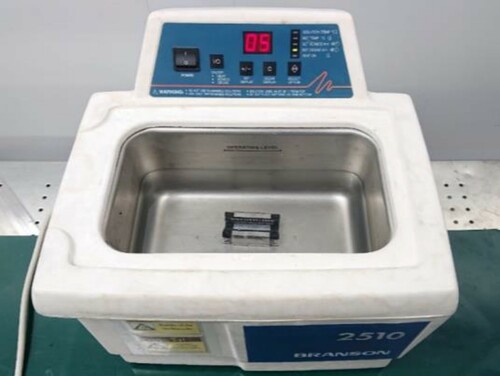
Figure 13. The sequence of data collected.
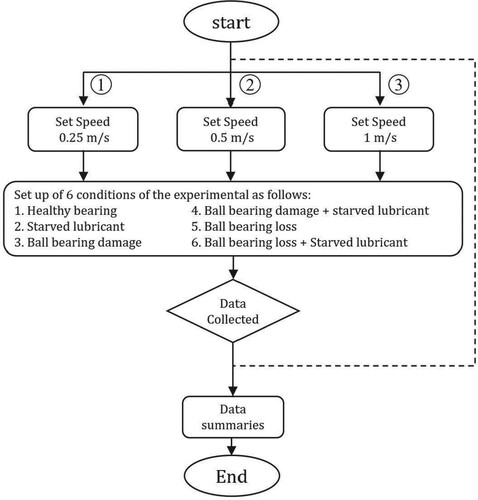
Figure 14. (a) Spectrum signal; (b) box plot of spectrum signal at speed 0.25 m/s .
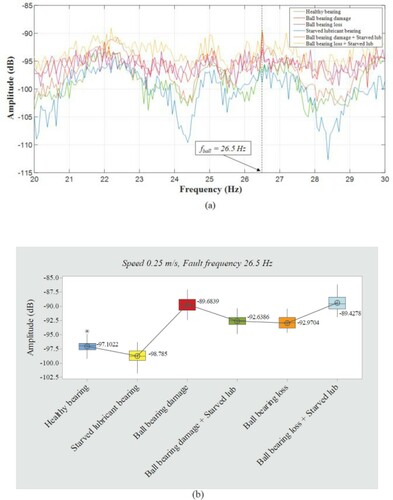
Figure 15. (a) Spectrum signal; (b) box plot of spectrum signal at speed 0.50 m/s .
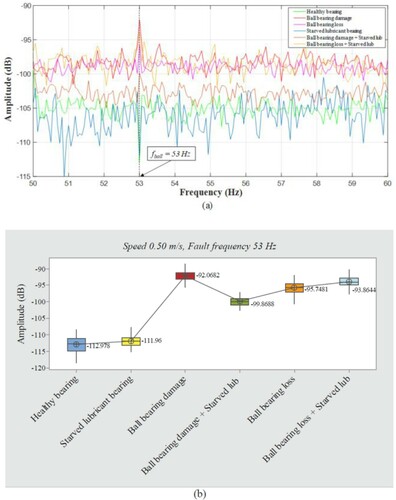
Figure 16. (a) Spectrum signal; (b) box plot of spectrum signal at speed 1.0 m/s .
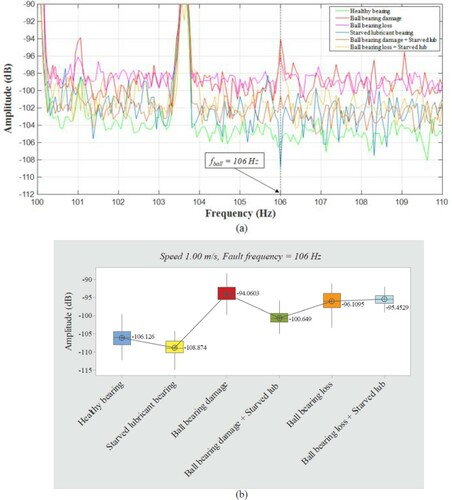
Table 2. Analysis of variance of current at a motor speed of 0.25 m/s.
Table 3. Analysis of variance of current at a motor speed of 0.50 m/s.
Table 4. Analysis of variance of current at a motor speed of 1.00 m/s.
Table 5. Summary of motor current for all bearing conditions.
Figure 17. Vibration signals in the time domain.
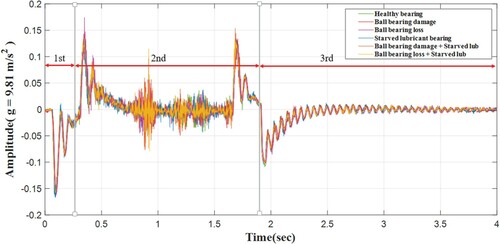
Table 6. Crest factor comparison of faulty conditions (0.25 m/s).
Table 7. Crest factor comparison of faulty conditions (0.5 m/s).
Table 8. Crest factor comparison of faulty conditions (1.0 m/s).