
Figures & data
Table 1. Sample statistics.
Table 2. ADL.
Table 3. Memory.
Figure 1. Variances of principal components.
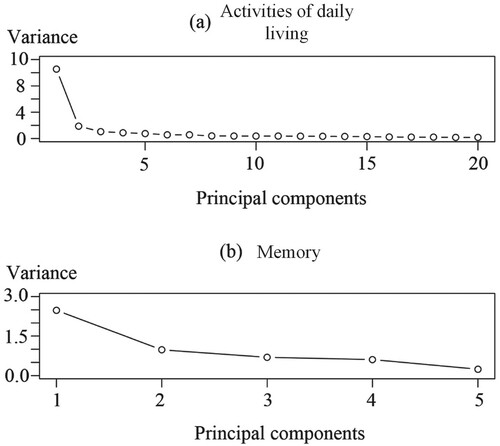
Table 4. Parameter estimated.
Figure 2. Comparison of the predicted residual life distribution based on the fitted model and the initial distribution. (Note: the distribution curves of the fourth and fifth predictions are too centralized to be shown in the plot, so the last two curves are interrupted; the following figures also have the similar situations).
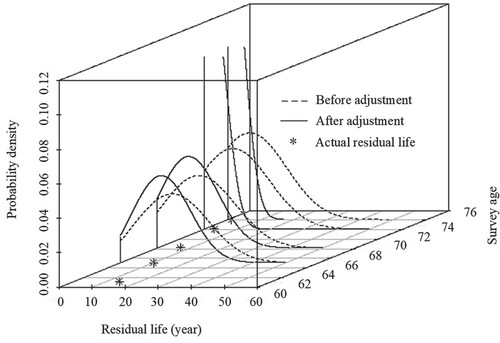
Figure 3. Comparison of the predicted residual life distribution based on the fitted model with Weibull distribution and the fitted model with exponential distribution.
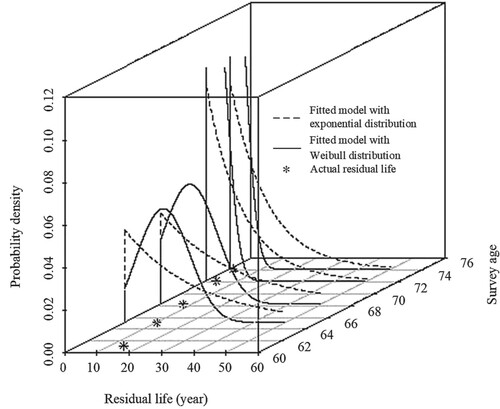
Figure 4. Comparison of the predicted residual life distributions from the proposed model and multiple linear regression.
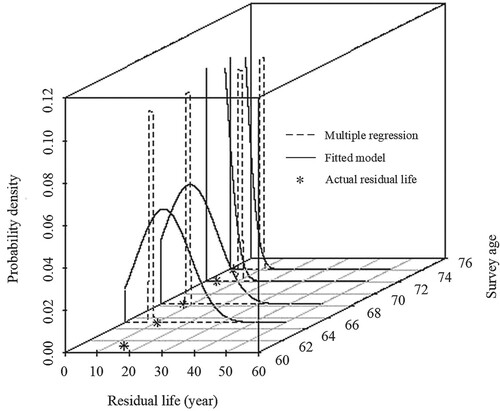
Figure 5. Comparison of the predicted residual life distribution based on the fitted model with Weibull distribution and the fitted model with exponential distribution.
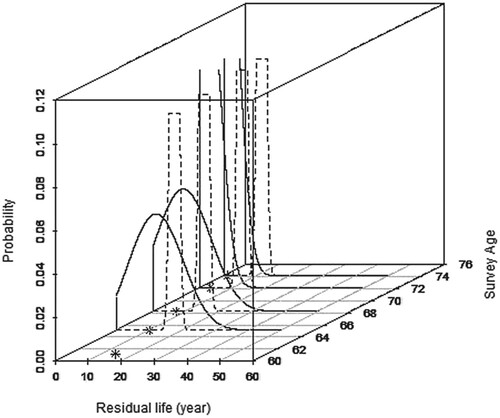
Table 5. Life table of Chinese population in 2010.