Figures & data
Table
Figure 1. Multiple GMM flowchart.
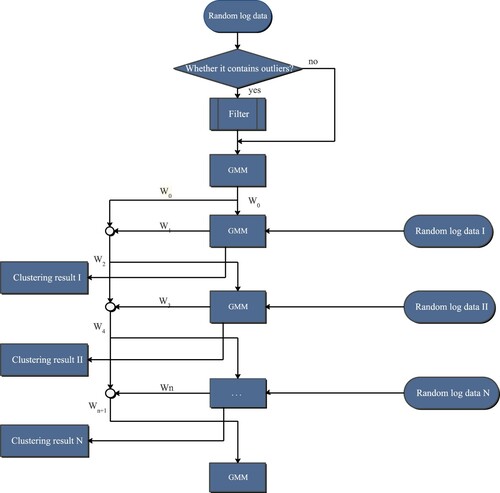
Figure 2. Double GMM flowchart.
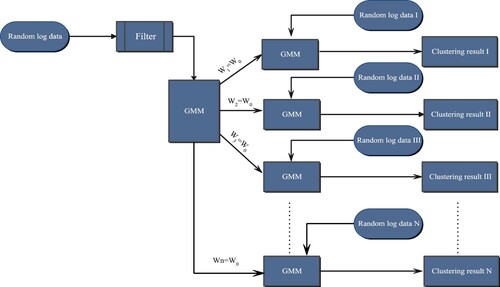
Figure 3. Schematic diagram of the influence of outliers.
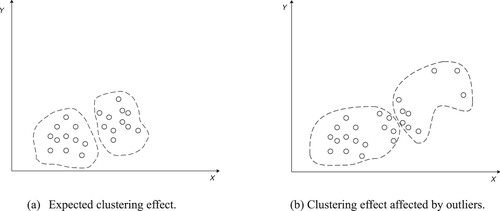
Figure 4. Block well diagram.
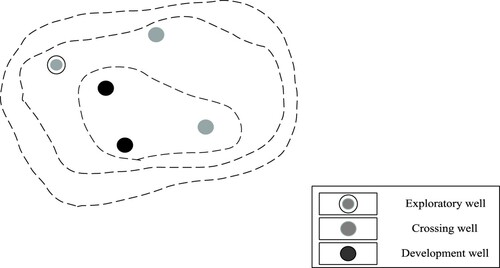
Figure 5. BIC assessment results.
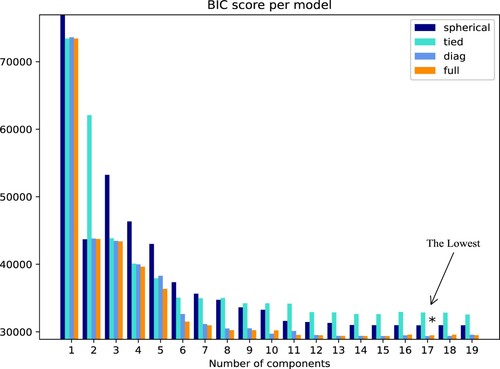
Figure 6. The difference between single and multiple GMM.
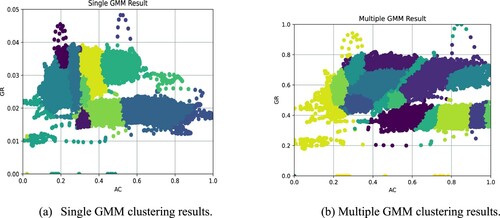
Figure 7. The clustering results correspond to the classification of XI well lithofacies.
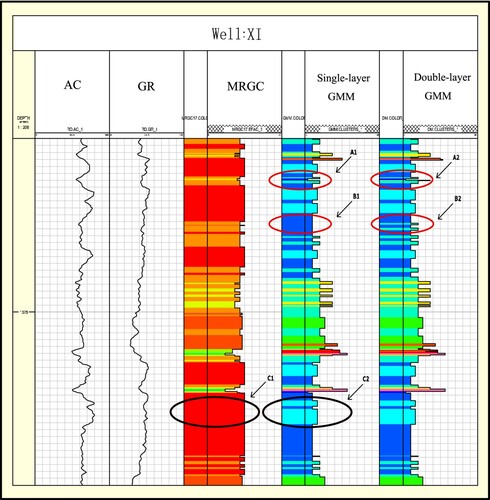
Figure 8. The clustering results correspond to the classification of XII well lithofacies.
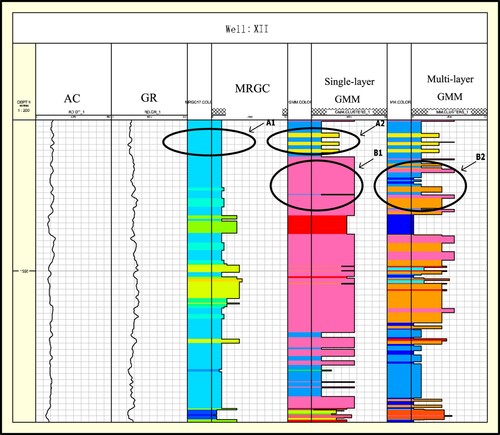
Figure 9. XII lithology multi-layer GMM classification results and actual comparison.
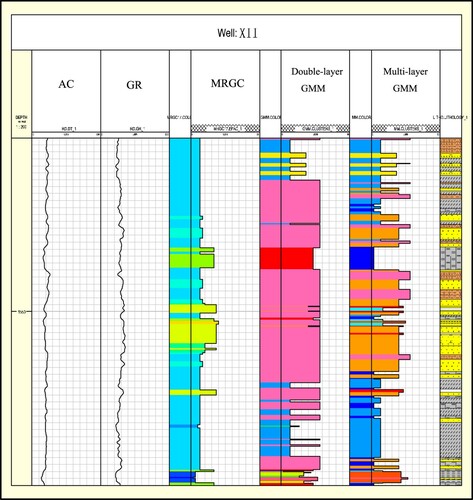
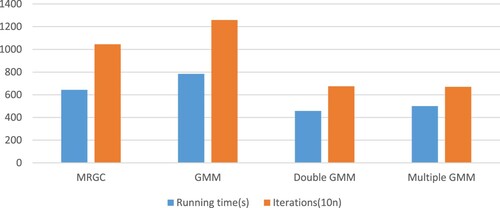
Figure 10. Operation efficiency of XI as an initialization well.
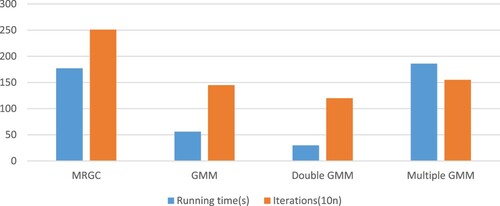
Figure 11. Operation efficiency of XIII as an initialization well.