
Figures & data
Figure 1. Five steps of FD and RUL prediction.
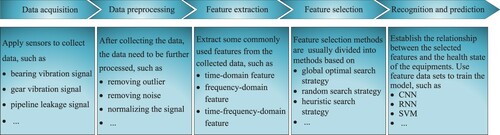
Figure 2. The methods of FD and RUL prediction.
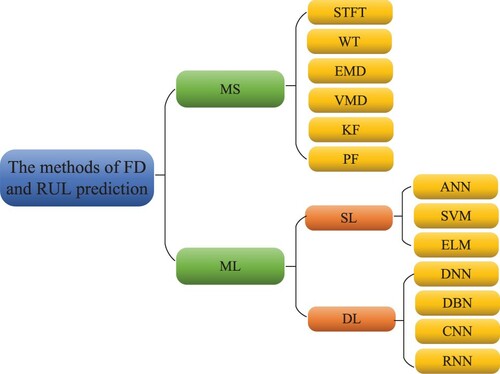
Figure 3. The structure diagram of the pumping unit.
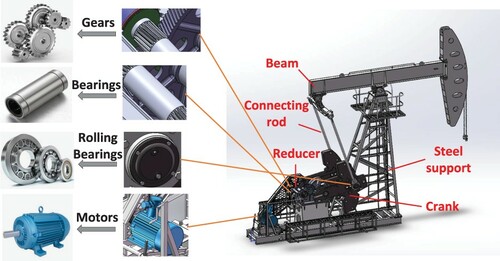
Figure 4. Diagrams of the failure of bearings and gears.
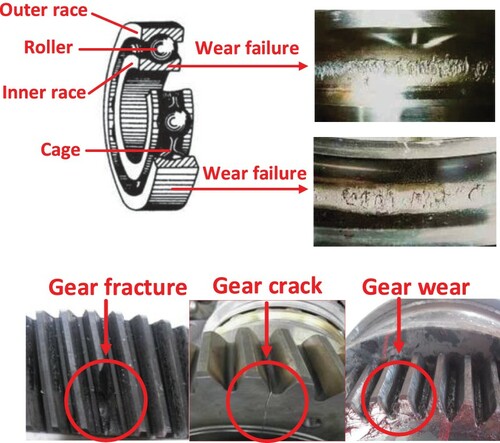
Figure 5. Typical PME and their main components.
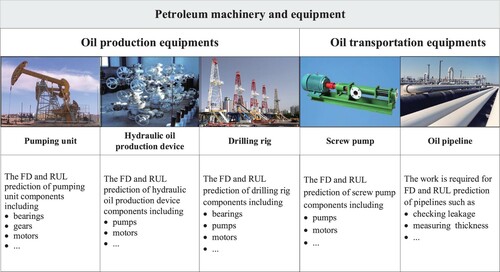
Figure 6. The decomposition of the EMD algorithm.
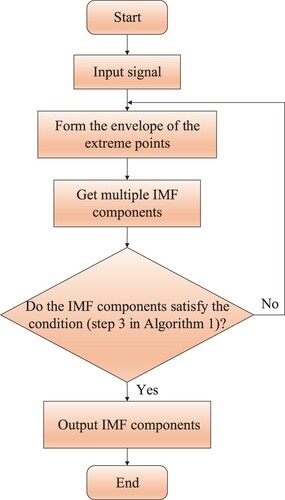
Figure 7. The process of FD based on KF.
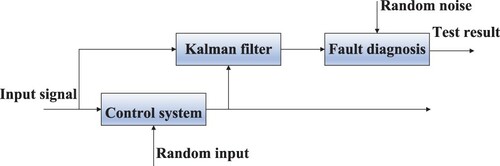
Figure 8. The structure of ANN.
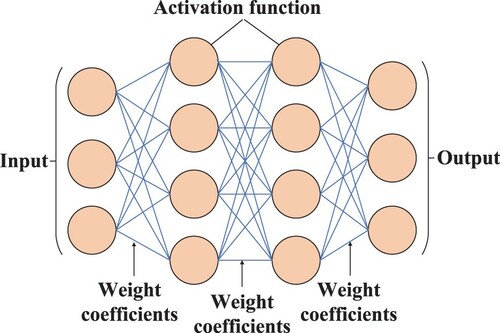
Figure 9. The illustration of basic SVM.
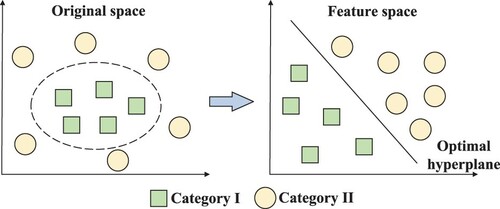
Figure 10. The structure of ELM.
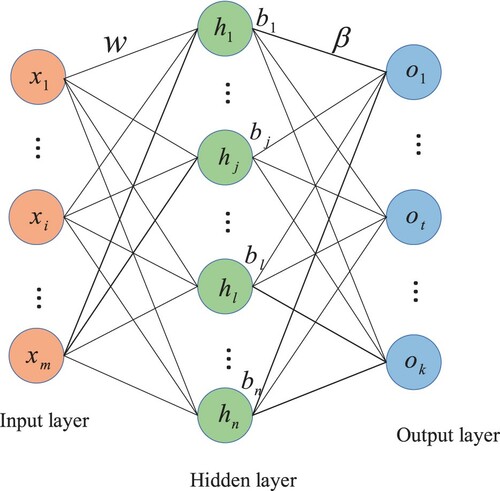
Figure 11. The structure of autoencoder.
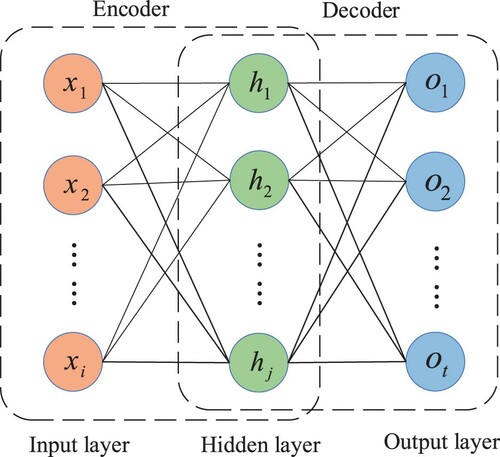
Figure 12. The formation process of stacked autoencoders.
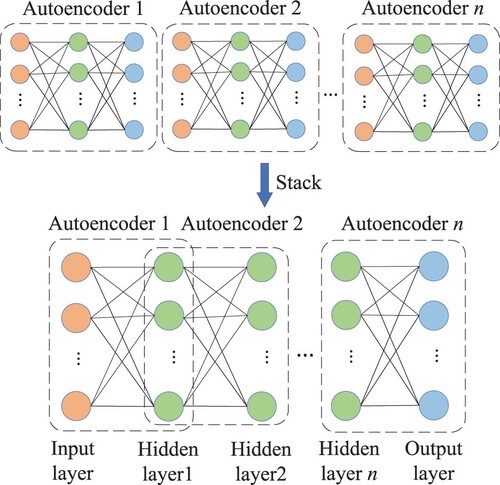
Figure 13. The structure of RBM.
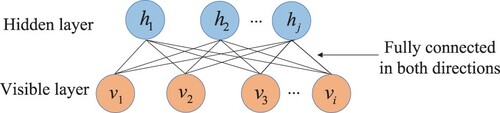
Figure 14. The structure of DBN.
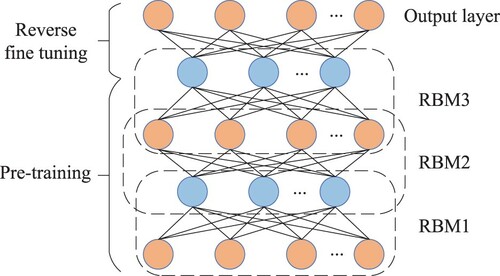
Figure 15. The structure of CNN.
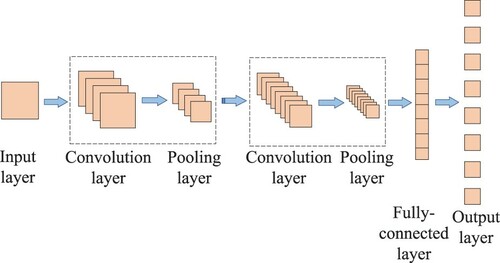
Figure 16. The structure of RNN.
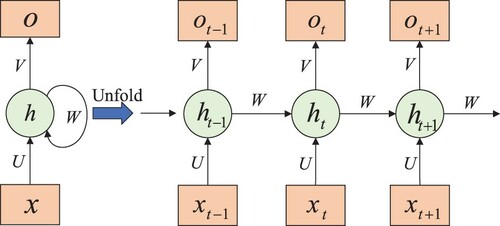
Figure 17. The structure of LSTM.
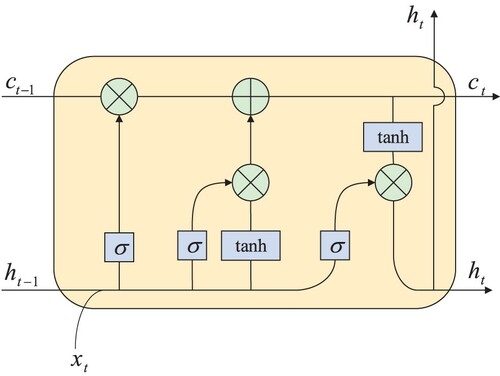
Table 1. Summary of FD and RUL prediction of PME.