
Figures & data
Figure 1. Scatter plot of good point set initialization and random initialization.
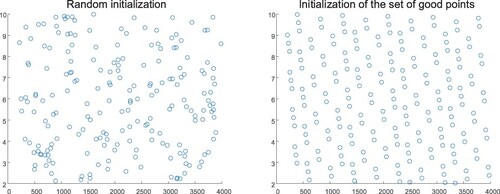
Figure 2. Iterative plots of improved CF and original CF.
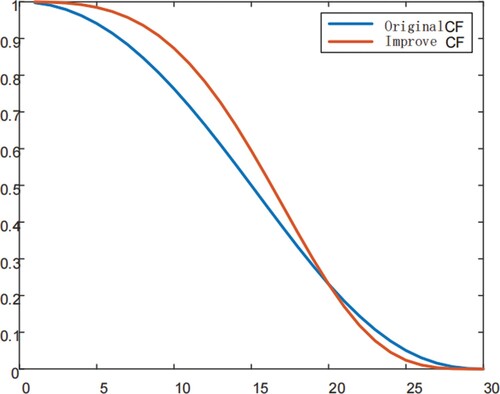
Figure 3. Curves of standard Cauchy distribution probability density function and Brownian motion probability density function distribution.
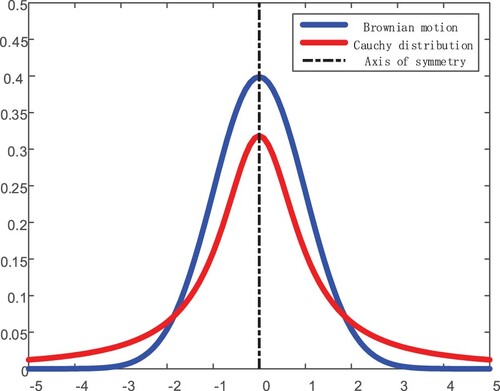
Figure 4. Scatter plot of standard Cauchy distribution and Brownian motion distribution.
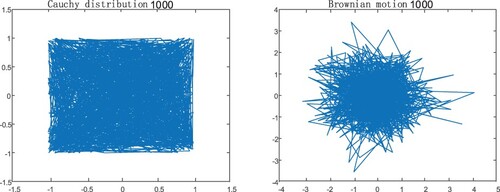
Figure 5. Flow chart of denoising of optimized VMD based on improved MPA.
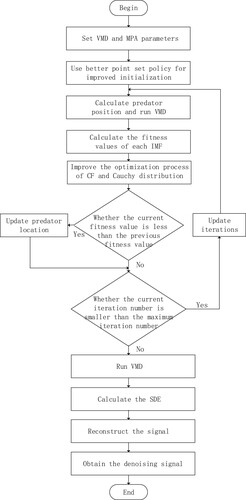
Table 1. Five standard test functions.
Table 2. Test results of standard test function.
Figure 6. Pipeline data waveform.
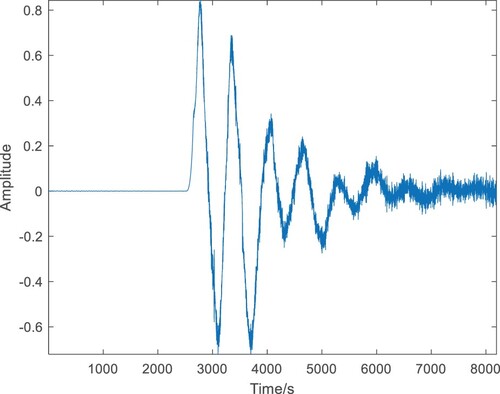
Figure 7. Pipeline signal decomposition spectrogram.
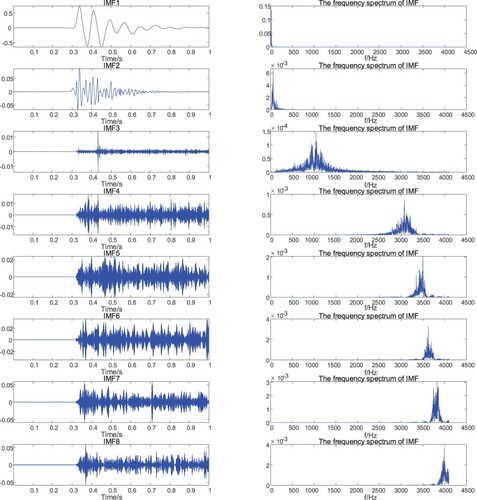
Figure 8. Line chart of dynamic entropy of pipeline signal.
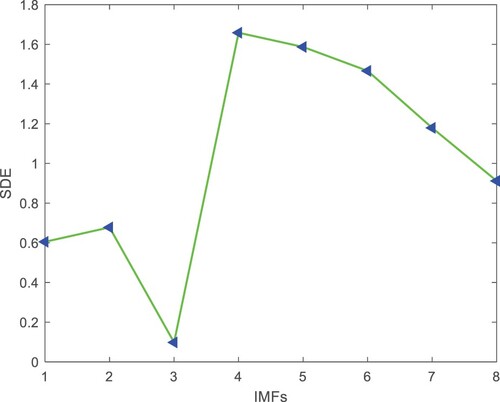
Figure 9. Reconstructed signal waveform.
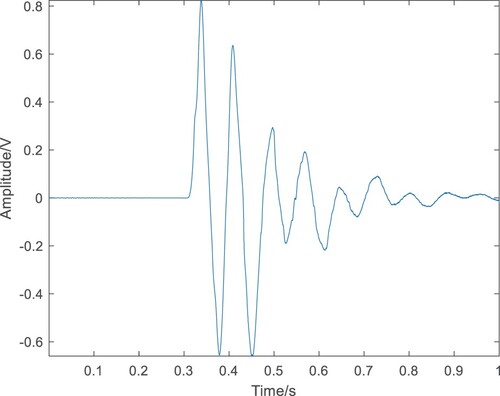
Figure 10. Original pipeline signal and reconstructed signal waveform.
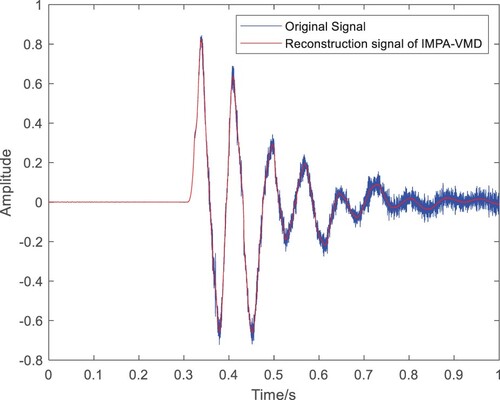
Table 3. Comparison of denoising effects of actual data.