Figures & data
Figure 1. Microgrid cluster architecture.
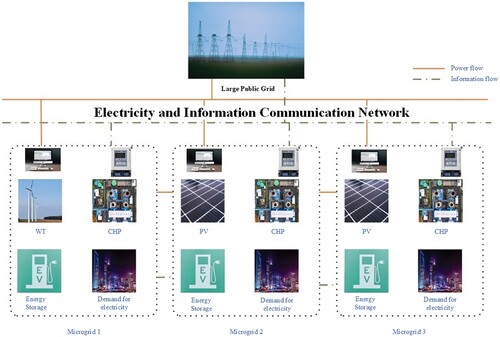
Figure 2. (a) MGa Forecast values of pre-day electrical load, thermal load and wind turbine output. (b) MGb day-ahead electric load, thermal load and wind turbine output forecast. (c) MGc day-ahead electric load, thermal load and wind turbine output forecast.
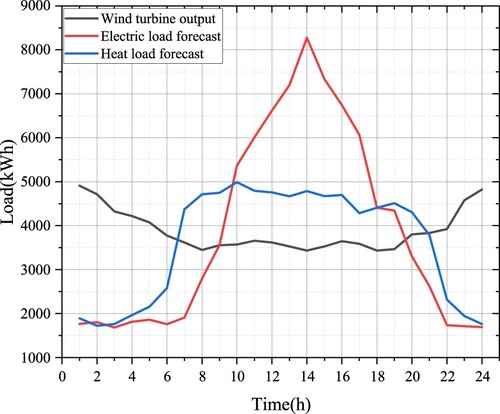
Figure 2b. Continued.
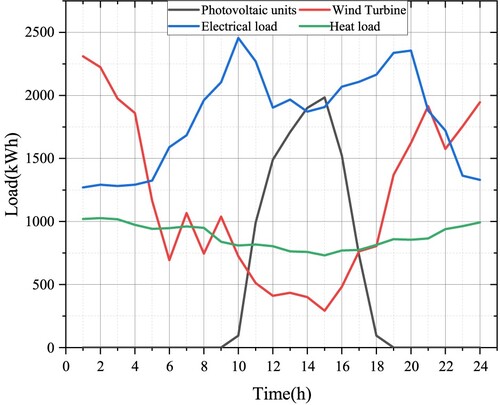
Figure 2c. Continued.
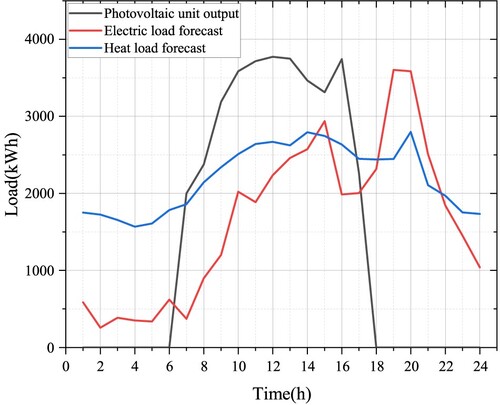
Table 1. Parameters of integrated energy microgrid dispatching model.
Table 2. Electricity purchasing price and selling price of Microgrid.
Figure 3. Microgrid cluster total operating cost convergence curve.
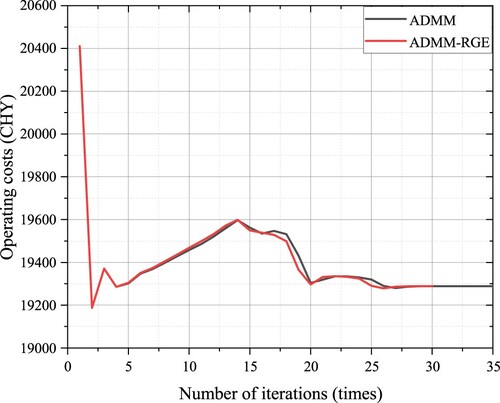
Figure 4. Electricity trading results of each subject in the microgrid cluster.
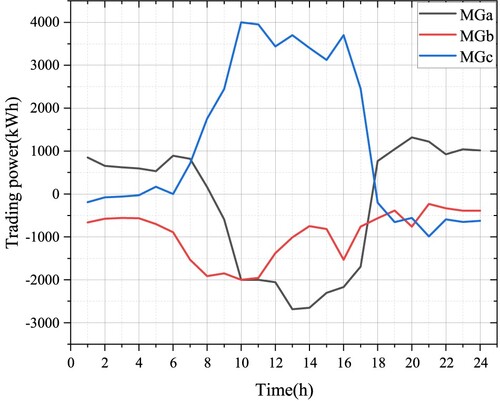
Figure 5. Electricity trading tariff results within the microgrid cluster.
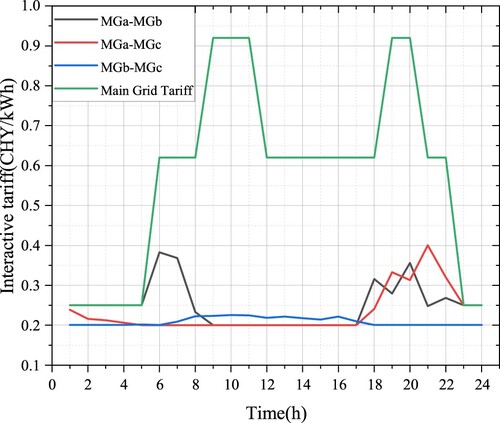
Figure 6. Power balance results for each subject within the microgrid cluster. (a) MGa; (b) MGb; (c) MGc.
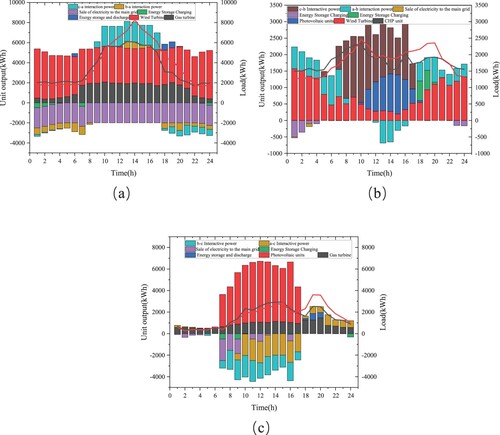
Table 3. Carbon emissions before and after microgrid cluster sharing with source-load uncertainty.
Table 4. Benefit and cost studies before and after microgrid cluster sharing under source-load uncertainty.
Table 5. Comparison of benefit distribution of standard Nash models.
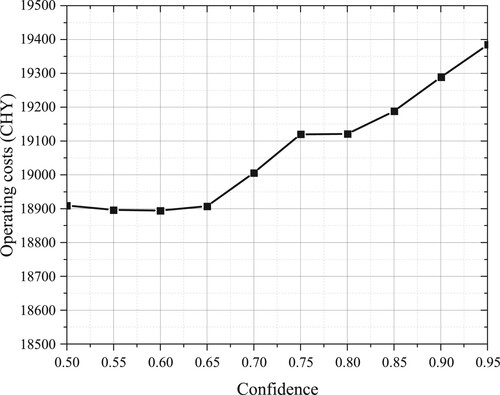
Figure 7. Relationship between confidence and operating costs.