Figures & data
Table 1. The IBCP Algorithm.
Table 2. The measured outputs under the DCS.
Figure 1. The actual output of y and its outputs based on ZOH and CP. (). (a) The actual output of
and its outputs based on ZOH and CP. and (b) The actual output of
and its outputs based on ZOH and CP.
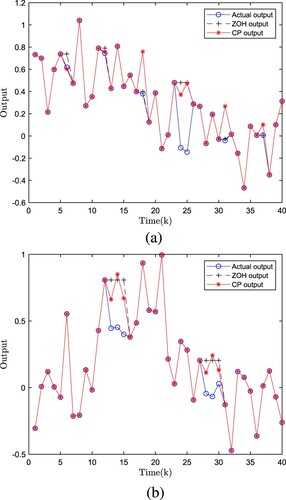
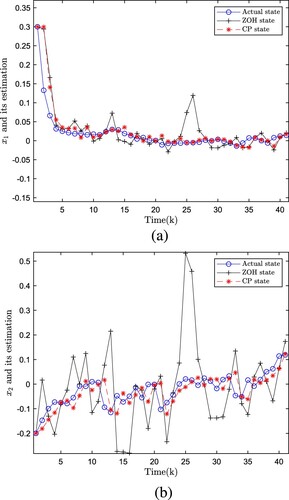
Figure 2. Actual states x and their estimates based on CP (
). (a) Actual state
and its estimate
. and (b) Actual state
and its estimate
.
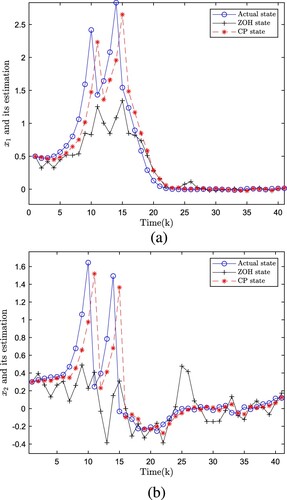
Figure 3. MSE on states based on ZOH and CP(). (a) MSE on state
based on ZOH and CP. and (b) MSE on state
based on ZOH and CP.
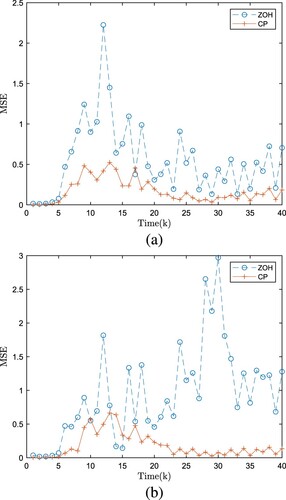
Figure 4. Actual states and their estimates based on CP (). (a) Actual state
and its estimate
. and (b) Actual state
and its estimate
.