
Figures & data
Figure 1. Customized passenger transport map of airport connection.
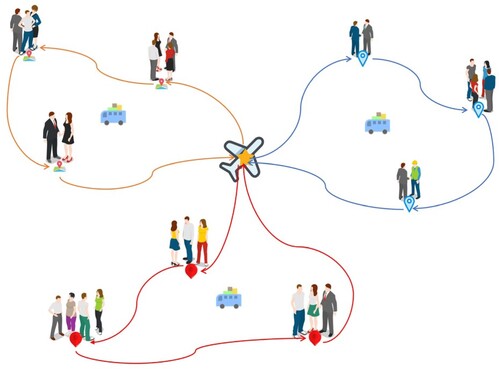
Table 1. Model parameters.
Figure 2. Chromosome code .
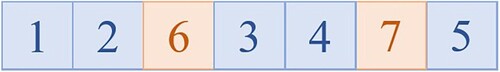
Figure 3. Chromosome code .
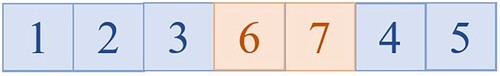
Figure 4. Chromosome code .
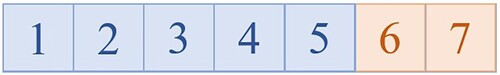
Figure 5. Schematic diagram of cross operation for different individual improvement sequences.
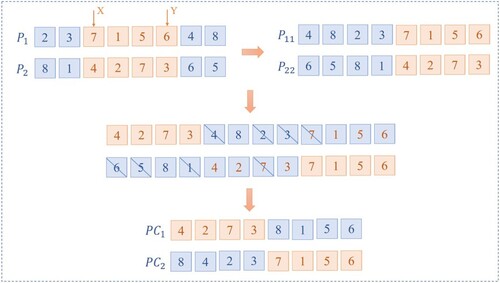
Figure 6. Schematic diagram of cross operation for the same individual improvement sequence.

Figure 7. mutation operation diagram.
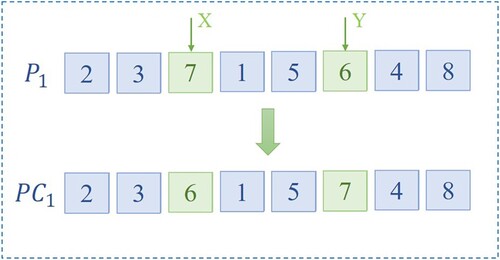
Figure 8. GA solution flowchart.
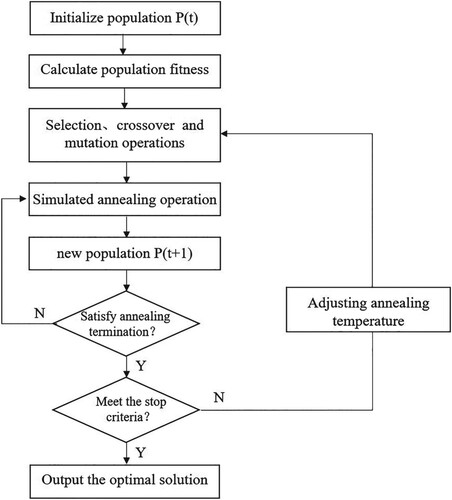
Table 2. Data for each node.
Table 3. GA experimental data.
Figure 9. Results under different combinations of crossover mutation probabilities.
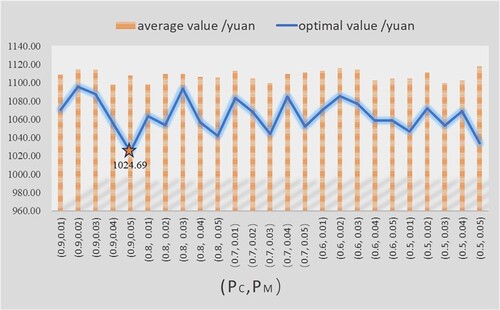
Figure 10. Average running time under different cross-mutation probability combinations.
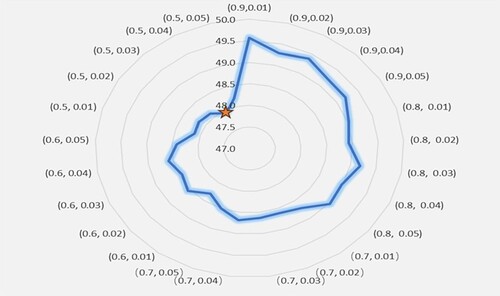
Figure 11. Iteration diagram.
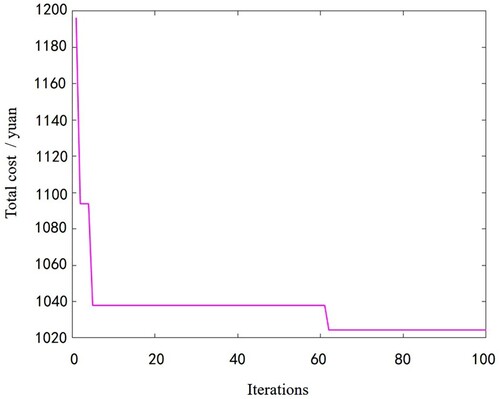
Figure 12. Path scheme roadmap.
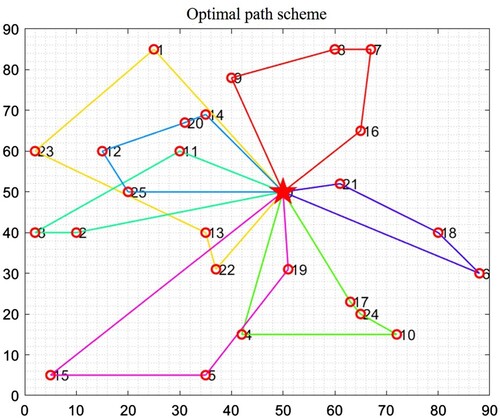
Table 4. Seven path information statistics.